Mar 2022
Tip of the Iceberg
Michael J. Cicero, CAIA
Director of Portfolio Research and Management

Whether you work with a financial advisor or “go it alone,” there are a variety of investment vehicles that can be used to achieve your allocation objectives, including mutual funds, exchange traded funds (ETFs), and individual securities. Are all investment vehicles created equal? For taxable investors, the answer is a clear “NO.” To illustrate this conclusion, the following is a brief study of the total cost taxable investors pay for mutual funds - some components of which are visible while others are well camouflaged.
Over the last two decades since the Securities and Exchange Commission began its Plain English initiatives, the mutual fund industry has greatly increased the transparency it provides to investors, from disclosing details of investment strategies to changes within the management of funds. One notable aspect of this expanded transparency is access to information, which investors can use to evaluate investment funds based on their expense ratios, also known as “internal fund fees.” Investors (and regulators) demanded better information as the public became aware of the detriment high fee funds have on long term wealth creation. Internal fund fees represent guaranteed detraction from gross performance and the figures can be astonishingly large, as you will see below. Thankfully, due to forced transparency, tools are widely available and easily found by investors to compare funds’ internal fees and make the best decision possible.
THE VISIBLE PORTION OF THE COST STRUCTURE - INTERNAL FUND EXPENSES.
Internal Fund fees vary greatly across fund structure, investment objective, and investment exposures. However, a few common themes appear to persist: 1) mutual funds are typically more expensive than ETFs, 2) investment objectives targeting active security selection are more expensive than passive or factor-based strategies, and 3) international exposures are more expensive than domestic exposures.
Here’s a quick look at internal fees for the “Largest 15 Active Mutual Funds”
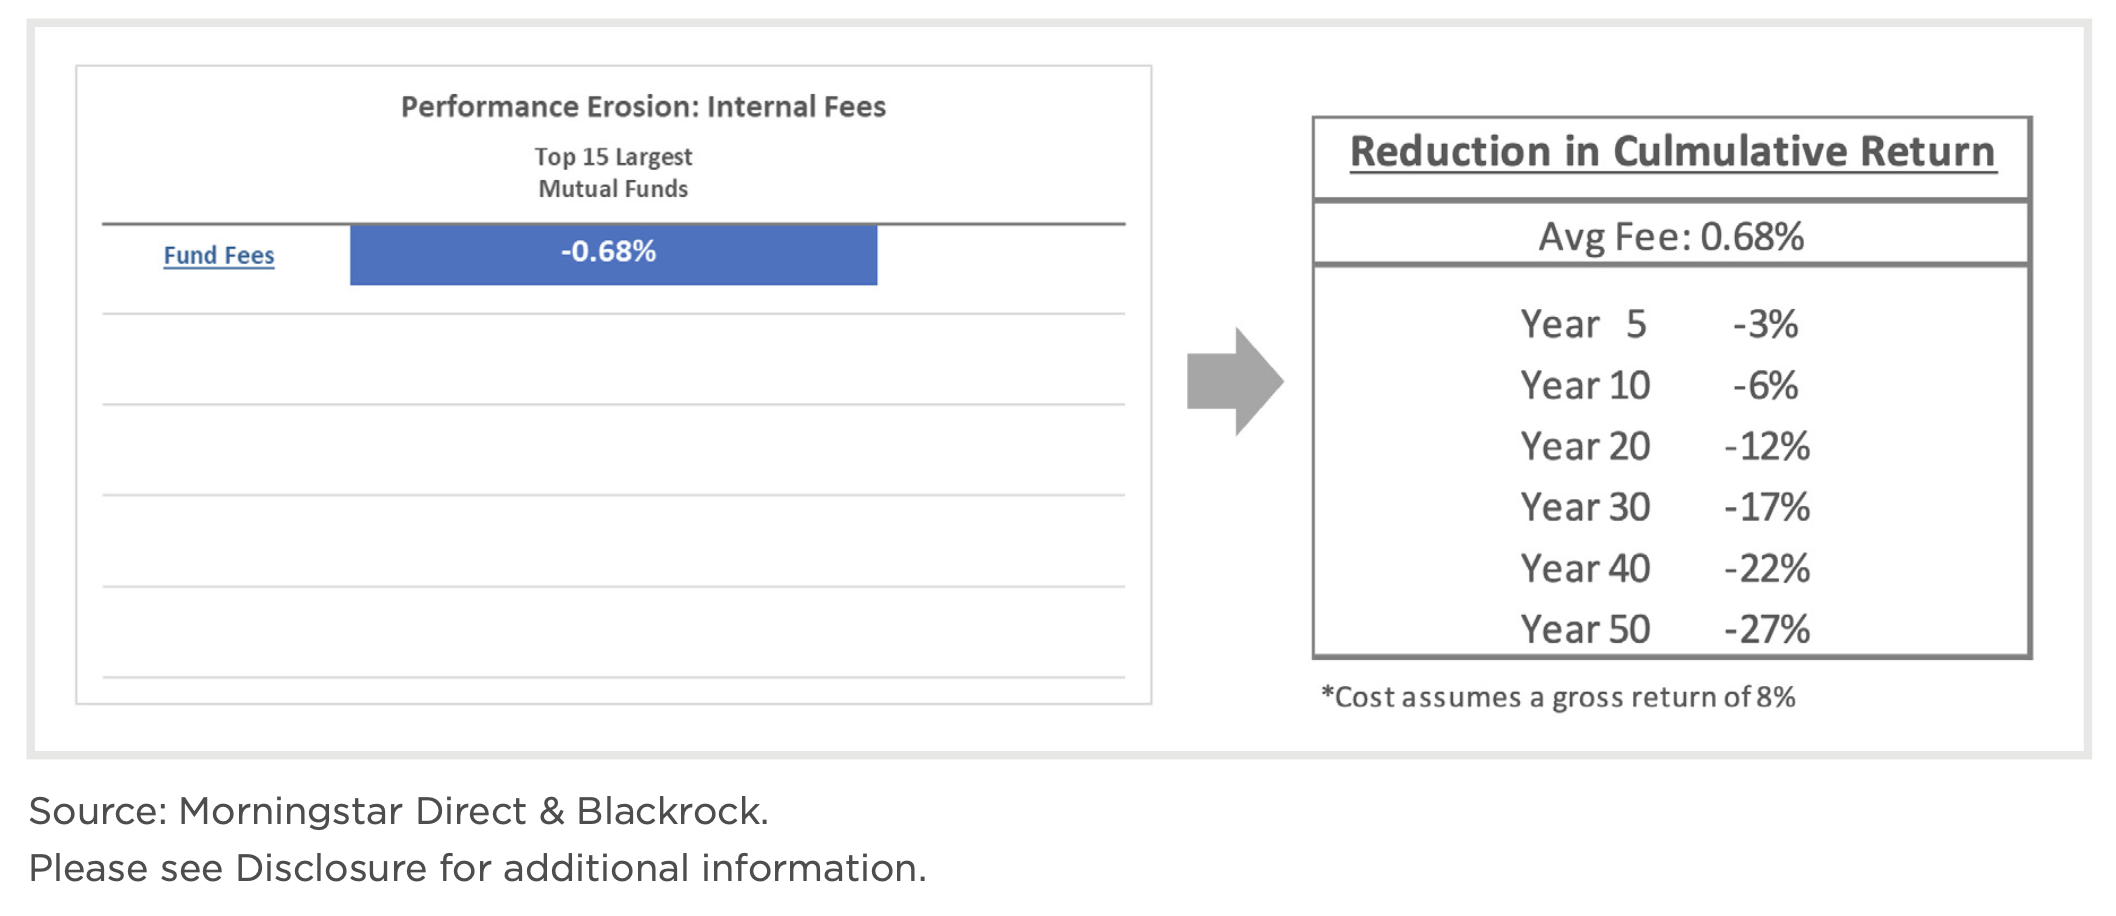
The average annual internal fee for the group in 2021 is 0.68%. That fee compounded over typical investment horizons is significant. Over 10 years, the compounded loss due to fees is 6%, and over a 50-year period the cumulative return is eroded by 27%. In dollar terms, if the investor started with a $100,000 investment, the value after 50 years would be reduced from $4.6m to $3.4m due to the fee. The power of “compounding,” but in the wrong direction.
The good news, as mentioned above, is that data is readily available that can be used to select funds with below average fees and reduce performance drag. While internal fund fees are in plain sight, they represent just one component of the total fund cost...and unfortunately often the least impactful. Lurking just below the surface is tax cost.
THE HIDDEN PORTION OF THE COST STRUCTURE - EXPENSES RELATED TO TAXES.
While the conclusions regarding internal fees are clear cut, a discussion of tax efficiency for taxable investors is often neglected. Fund managers will say tax efficiency falls outside the investment objective in their prospectus and focusing on the tax aspect will put them in breach of their stated goals. Brokers and financial advisors will say it is “too hard” to rank funds based on tax efficiency because every investor’s tax situation is “unique.” We believe it should be just as simple as it is for internal fees for investors and their advisors to select investment vehicles based on tax efficiency...and we bet your CPA would agree!
Like internal fees, there are a couple of generalizations that can be made about the impact of taxes. 1) Mutual funds are less tax efficient than ETFs due to the structural differences which require mutual funds to distribute gains on an annual basis. 2) Mutual funds expose the investor to co-investment risks such as receiving a capital gain tax bill without taking part in the actual gain. For instance, the largest active mutual fund currently has an embedded capital gain exposure of 65%, according to the Morningstar database. New investors buy in at the Net Asset Value which includes the capital gains; as those gains are realized by the Fund’s managers trading activity, the new investors will get the tax bill for them even though they did not participate in the gain.
3) Active stock picking strategies that attempt to exploit price inefficiencies and/ or time market movement tend to make larger trades more frequently. As a result of this higher turnover, they are typically less efficient than passive or factor-based strategies.
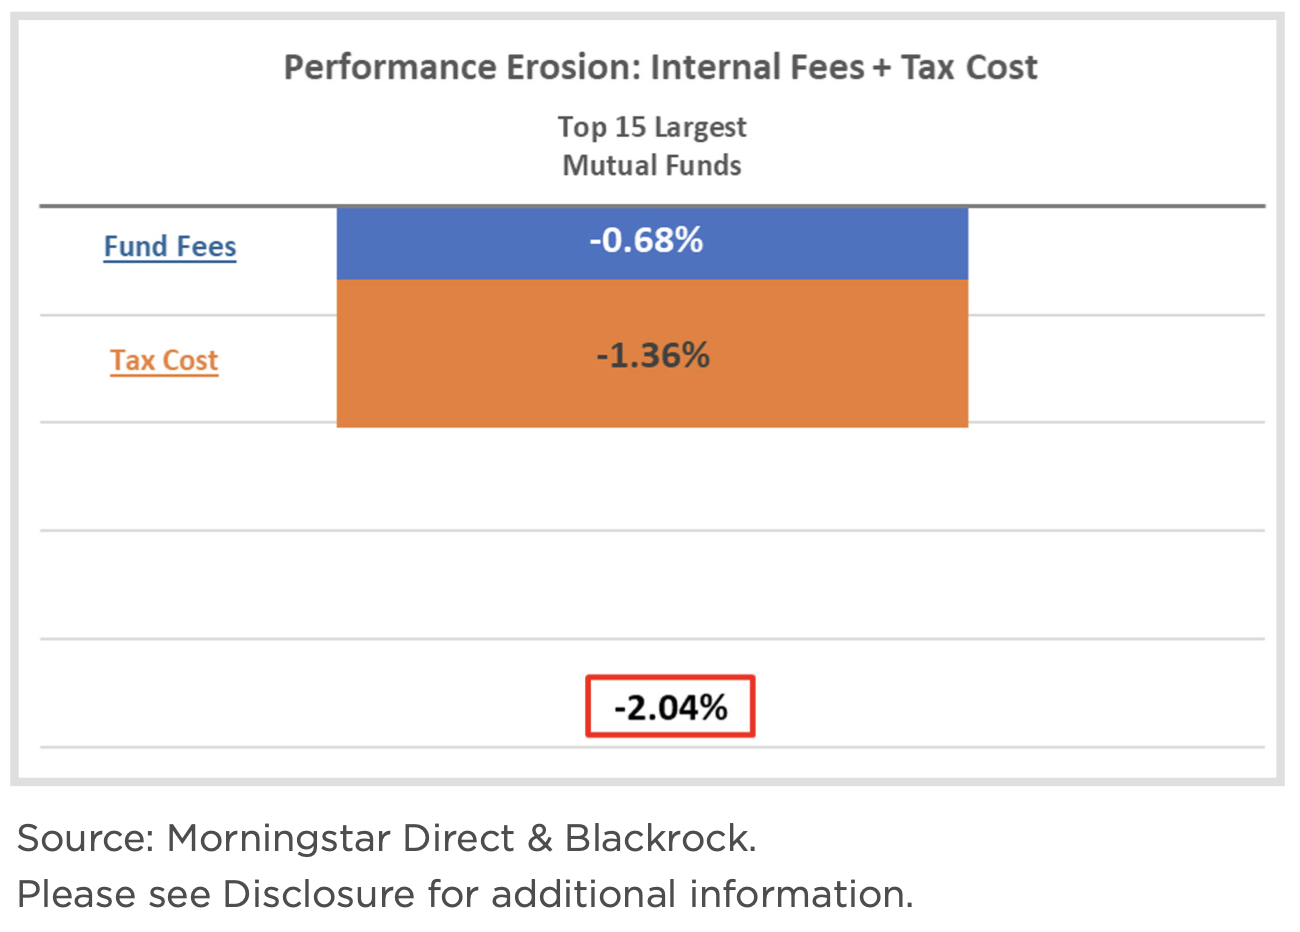
A look at the tax efficiency, or lack thereof, in 2021 for the Largest 15 Active Mutual Funds is illuminating. This
analysis assumes the group of funds were held without sales or purchases from December 31st, 2020 to December 31st, 2021. As a result, the tax impact is based exclusively on short- and long-term capital gains distributed by the funds throughout the year. To calculate the “tax cost,” we assume that the out-of-pocket tax payment, generated by the distributions, is made by an individual in the highest tax bracket. The dollars used to pay the tax are expressed as a percentage of total fund value, in the same manner as internal fund fees. We find that the average out-of-pocket tax cost for the 15 largest active mutual funds is 1.36%, which is double the amount of the internal fund fee. The performance hurdle that must be overcome for an investor to produce a gain equal to the benchmark for the year is growing—after the tax cost is added to the internal fee the hurdle increases to 2.04%! That means the fund needs an excess return at least equal to 2.04% to just match its benchmark.
Proponents of active stock-picking will claim that “superior performance” will make up for the loss caused by fees AND tax inefficiency, while providing additional return to beat the benchmark. Support for this claim usually includes reference to pedigreed portfolio managers, exceptional research team, groundbreaking technical innovations, and proprietary investment models that, for all those reasons, cannot be found elsewhere. Of course, this is also why the internal fees are as high as they are. Ironically, we find not only do taxes and fees continue to erode portfolio performance, but also the “advantage” touted by mutual fund companies and financial advisors as overcoming these hurdles has been a challenge for most active funds.
In fact, according to the S&P Dow Jones 2020 Year-End SPIVA® Institutional Scorecard, “77% of large-cap mutual fund managers underperformed the S&P 500 on a gross- of-fee basis over the past 10 years.”
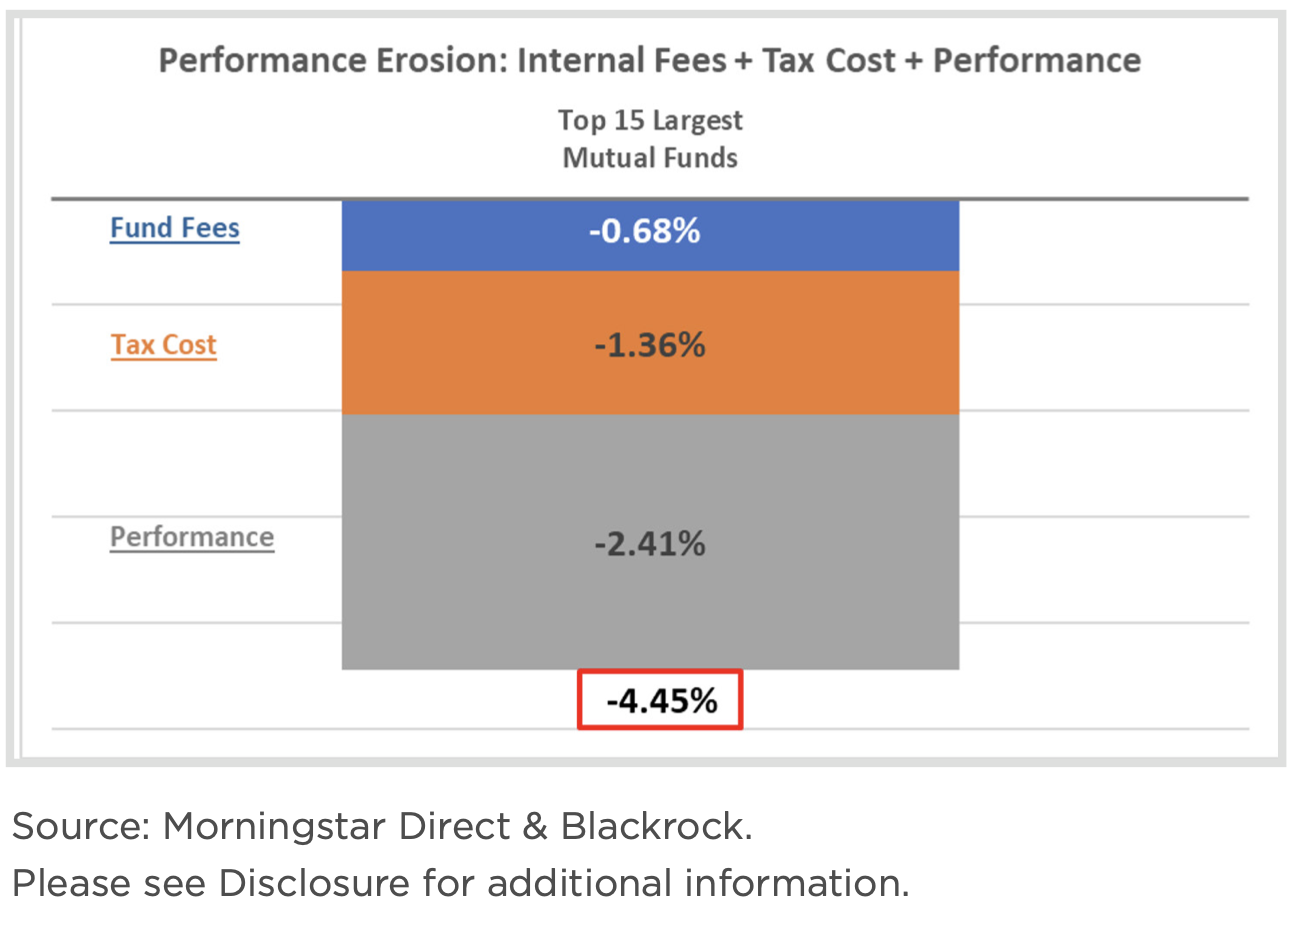
For the largest 15 active mutual funds in the year 2021, performance not only falls short of the 2.04% hurdle, but contributes to underperformance compared to their respective benchmarks.
This group underperformed their respective benchmarks in 2021 by an average of -2.41%, bringing the total cost from -2.04% to -4.45%! Remember the impact of negative compounding on just the internal fee of 0.68%? A cost of -4.45% is a BIG number in one year and unimaginable if extrapolated out 10, 20, or 50 years.
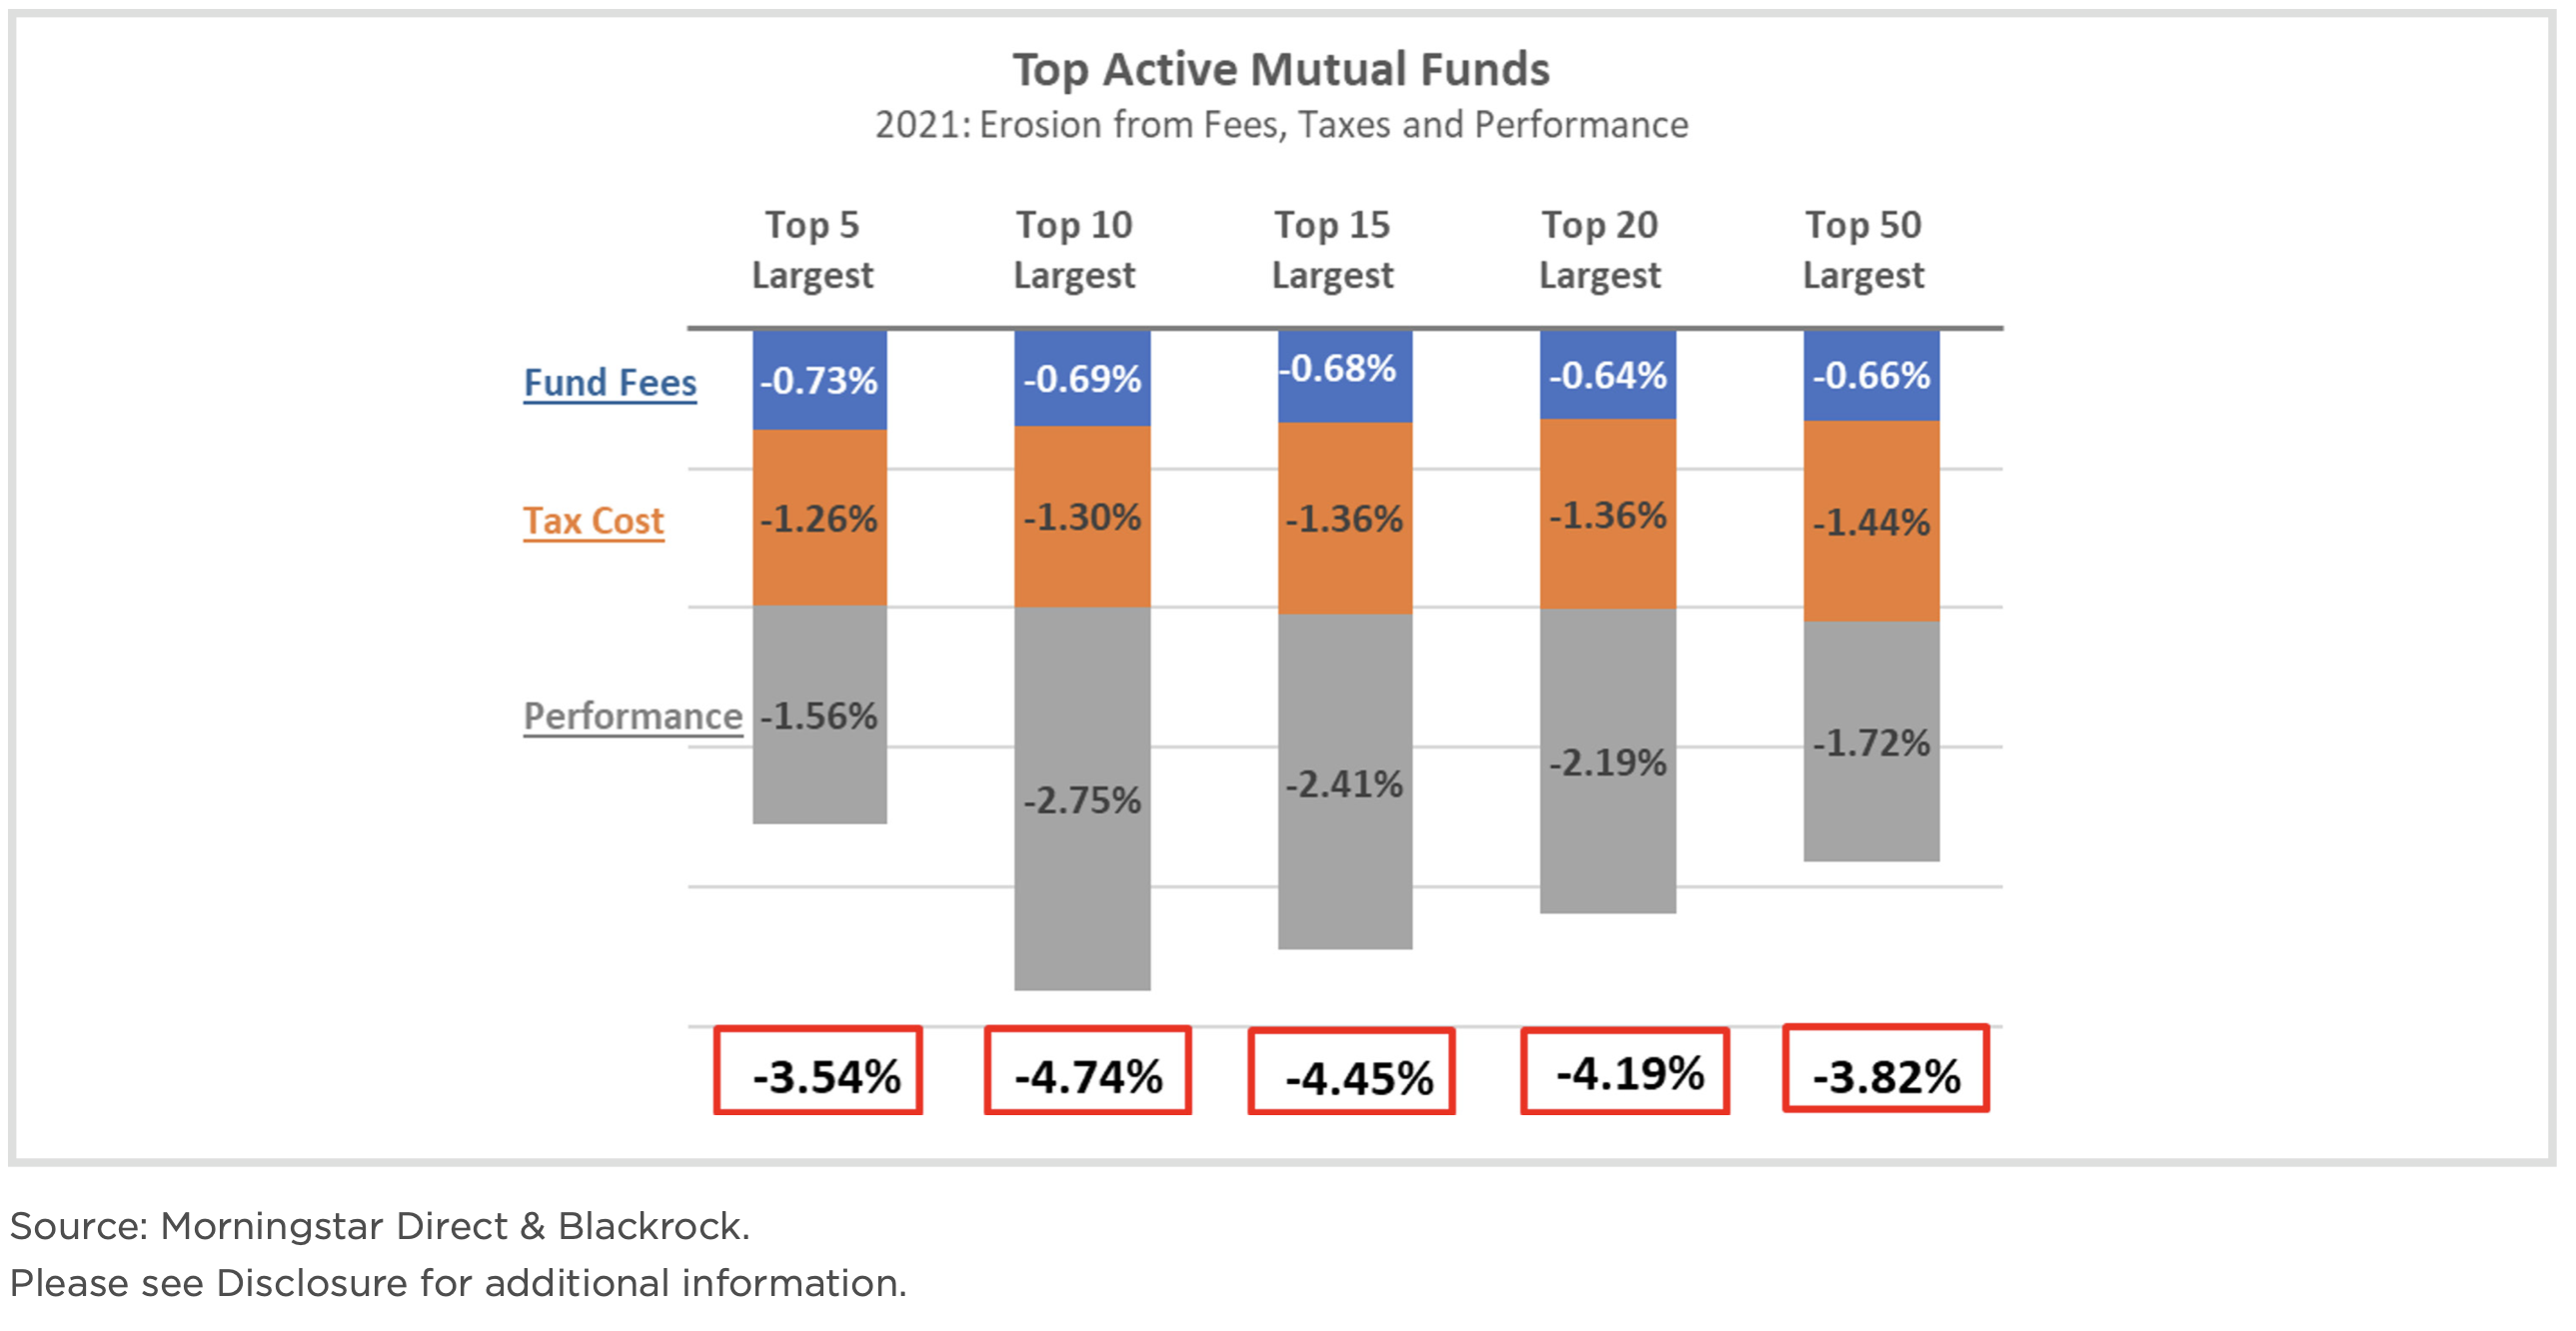
Is this experience unique to just the Largest 15 Active Funds? We expanded the scope to examine additional groups and found the trends in fee, tax cost and performance appear to be pervasive in the sample from 2021.
AN ALTERNATIVE TO MUTUAL FUNDS – ETF TAX EFFICIENCY.
While academic evidence based on fees, tax cost and performance should point advisors in the direction of building portfolios using ETFs to employ passive or factor strategies, there are other longer-term benefits that should be considered, namely the value created by ETFs provides the opportunity to defer realization until an optimal tax year.
Due to their innovative fund structure, ETFs generally do not distribute meaningful capital gains on an annual basis, only their income is distributed. As a result, the investor pays the capital gain tax at the end of the investment period when the ETF is sold. Mutual funds on the other hand are bound by regulations that require distribution of income and capital gains, so the end investor pays tax annually.
We’ve included a side-by-side comparison of two mutual funds and an ETF. This illustration assumes a 10-year investment period and an 8% annualized return, made up of 1.5% income and 6.5% capital gain for each investment. It is assumed that all three investments will distribute 100% of their income annually. However, in this example, the distribution of capital gains will differ between the three. The mutual funds will distribute 33% and 100% of capital gains each year, respectively, and the out-of-pocket tax payment (assuming a blend of long- and short-term rates) will be deducted from the value of the investment. The distribution amounts of 33% and 100% capture most investment strategies seen in mutual funds and should represent two ends of the spectrum. In contrast, ETFs will distribute little if any gains on an annual basis, all of which will be realized at the time of final liquidation. For this reason, the illustration represents 0% distribution of gains for the ETF. Even over this relatively short period of time, the comparison shows the benefits of deferring tax payments and keeping more money growing for longer.
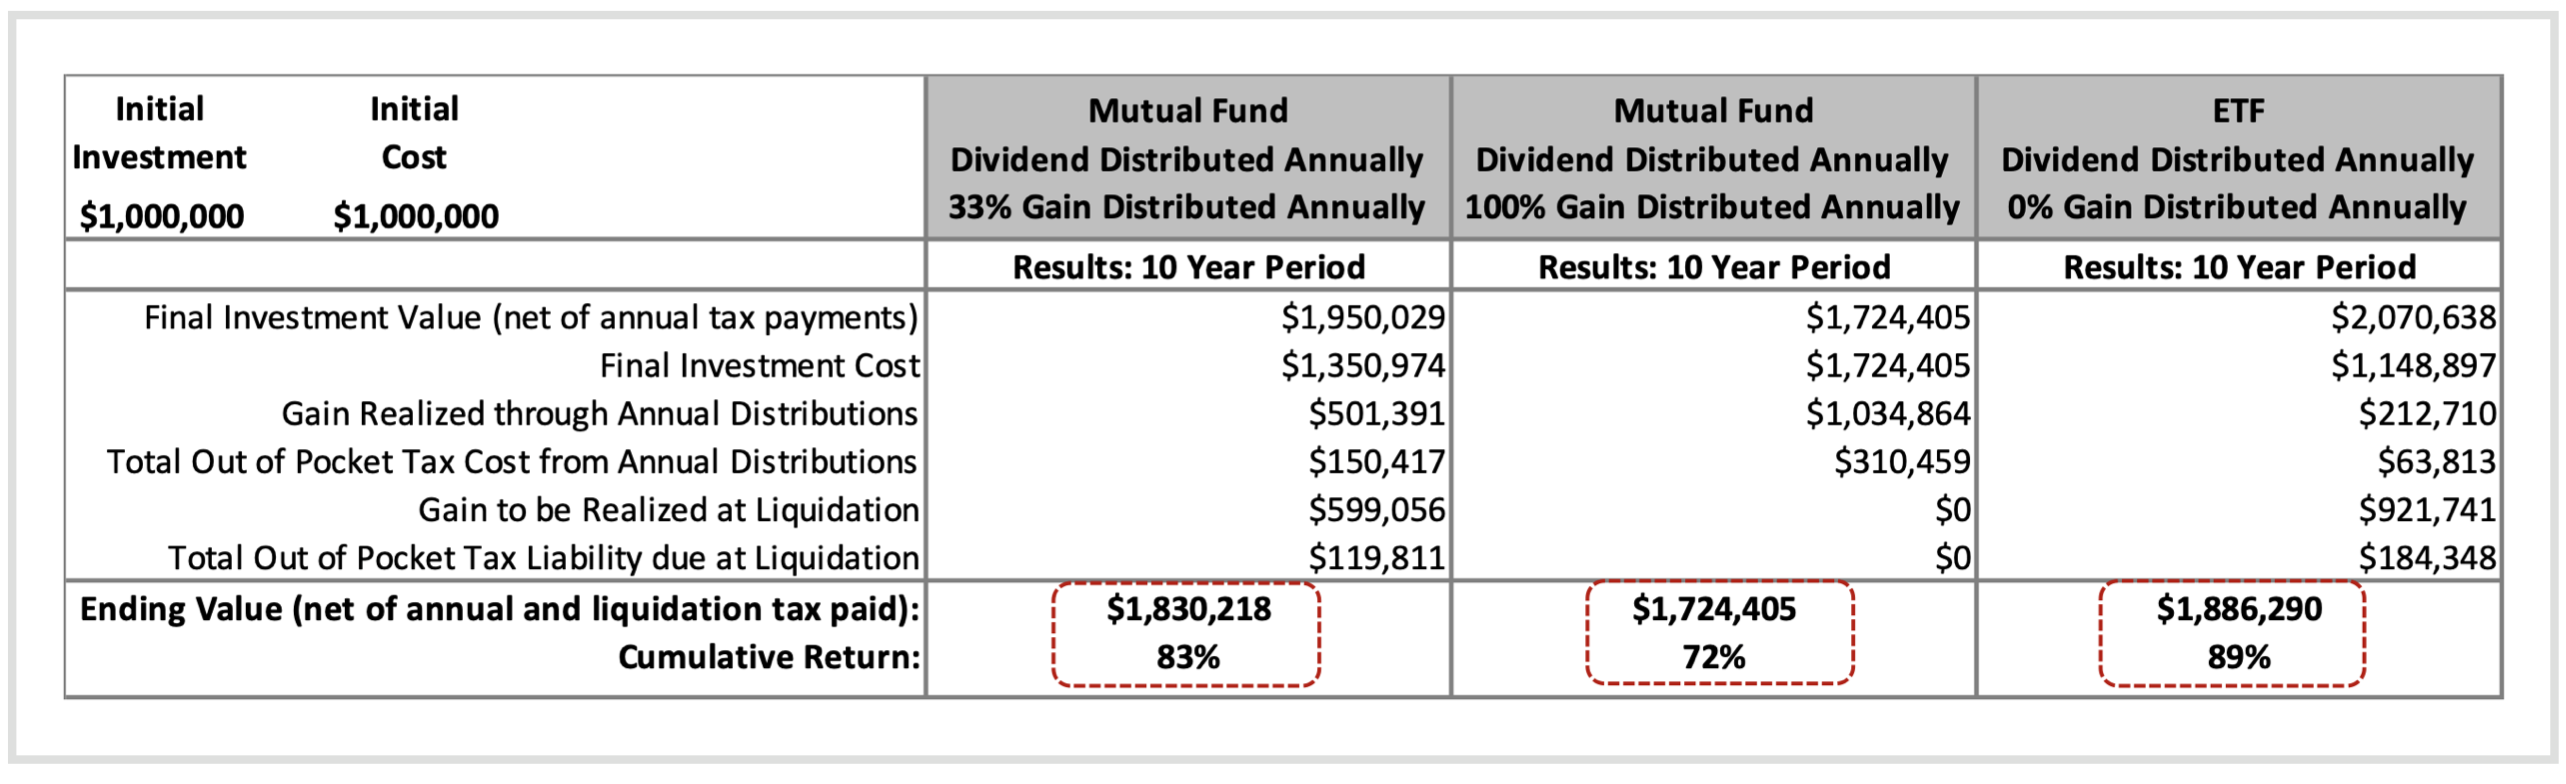
At the end of the period and after final liquidation, the difference between the mutual funds and the ETF is 6-17 percentage points of cumulative after-tax return. The tax efficiency of the ETF, on an annualized basis, represents a contribution to performance of 0.58% and 1.58% each year. Presented in terms of dollars, based off an initial investment of $1 million, delaying the realization of capital gains added $56,000 to $162,000 to the portfolio value by the end of the period. Also, the ETF structure gives investors the option to pick the most beneficial year(s) to realize gains. This optionality would improve upon the results shown in our illustration.
We started with a discussion about internal fees, the most visible aspect of cost to an investor, which is front and center on fund evaluation platforms, the media, and even discussions with financial advisors. While controlling internal fees is very important, we would argue tax efficiency is an equally crucial aspect to portfolio evaluation and, if overlooked, may erode wealth with greater severity than fees. Include other aspects like underperformance and the mass below the surface can be 4x to 6x that of internal fees, like we witnessed in 2021. The benefits of ETFs over actively managed mutual funds for taxable accounts are not just theoretical, they are playing out in taxable portfolios every day. The foundation of your investment strategy should be in your best interest, which includes using the cost and tax advantages of ETFs for your taxable portfolios.
MAKING YOUR TAXABLE PORTFOLIO MORE EFFICIENT – ACTION STEPS.
If you have a taxable portfolio managed by an advisor that is invested in mutual funds, especially in active stock picking strategies, we encourage you to:
HPA was built on the tenets of minimizing costs and maximizing tax efficiency while delivering evidence-based investment strategies. Please contact us if you would like us to analyze the cost and tax efficiency of your current portfolio. You’ll be interested to learn what we are able to uncover.
DISCLOSURE: Groups of the “Top” mutual funds were formed based on Morningstar data by sorting active equity focused mutual funds by AUM. Oldest share class was used to generate the average fee. Tax impact estimates assume highest tax bracket. Capital gains that have not been distributed are based on projections for 2021.
Source: BlackRock Advisor Center - Tax Evaluator. All data is as of 11/30/21. Past performance is not indicative of future results.
INVEST SMARTER
Call (585) 485-0135 to discuss how a factor-based approach could pay off for you.