Feb 2019
The HPA Factor Series:
Value
Value
Michael E. Jones, CFA
Michael J. Cicero, CAIA

High Probability Advisors, LLC was created to take advantage of the investment benefits offered through the use of specific “factors” within the construction of our portfolios. Factors are not new, the structure has been used by practitioners for more than 40 years. The combination of several factors in a multi-factor strategy is a more recent development.
Each of the five factors utilized by HPA have been identified and supported through academic and industry research as providing an evidence-based approach to enhance return and/or reduce volatility within an investment portfolio.
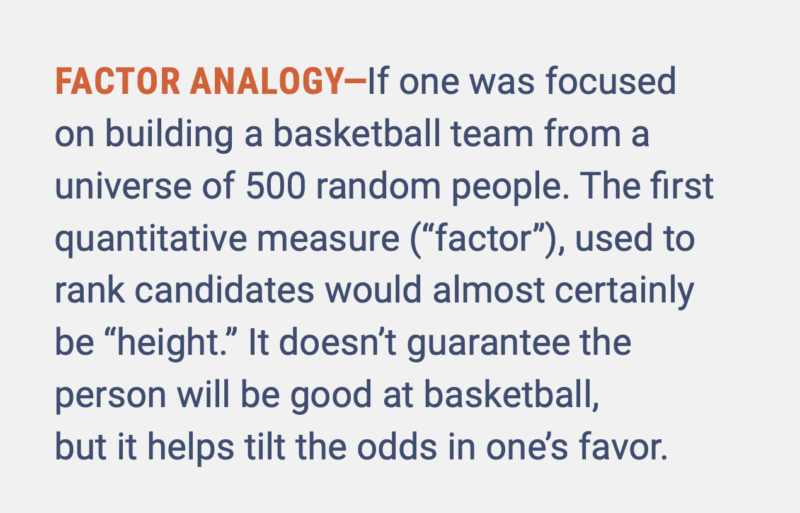
We describe a factor as a quantitative measure that can be systematically applied to a universe of stocks or bonds. The results of those measures (factor rankings) naturally group securities with similar characteristics, which academic evidence has proven to exhibit specific performance/risk tendencies over longer periods of time.
The future performance of stock groups that have favorable rankings for any factor is typically superior to the rest of the stocks in the universe. It is important to note that this is a tendency and not a guarantee, especially in short to medium time frames. Historical data shows the high statistical probability that the factor will outperform in most given time frames.
Does this past performance foretell the future? The success of factor-based investing is premised on the expectation that the historically observed performance patterns will persist in the future. How can we know if this is true? The academic world applies rigorous statistical tests to ensure significance for the results of factor experiments, but practitioners take the analysis a bit further. In their 2016 book, Your Complete Guide to Factor Based Investing, Andrew Berkin and Laurence Swedroe address this question thoroughly. They conclude that for any factor to be worthy of investment, it must meet five criteria: it must be persistent, pervasive, robust, investable and intuitive.
In this series of short papers, we will identify and explore the specific factors that HPA uses in portfolio construction. Along with the definitions, we will touch on the Berkin & Swedroe criteria for each. We will add our notes on the pros and cons of each factor in various real-world applications. Our last paper in the series will examine HPA’s multi-factor strategy.
The Value Factor
Value was the earliest factor to arrive on the scene. The research work of professors Benjamin Graham and David Dodd was distilled in their 1934 book, Securities Analysis, which Warren Buffet calls “the roadmap for investing that I have been following for 57 years”.1 Their efforts identified certain valuation-based measurements that were critical to security selection. Graham’s subsequent writings and teachings built the foundation for value investing. Additional research was published through the years, including the widely acclaimed paper, “The Cross Section of Expected Returns” by Eugene Fama and Kenneth French in 1992, which identified both value and size as verified factors in stock market returns.
From these roots, “Value Investing” became a standard discipline in the investment industry.
Academic and industry research shows that “inexpensive” stocks beat “expensive” stocks. Defining “inexpensive” and “expensive” is done by selecting a measure from a company’s financial reports (income statement, balance sheet, etc.) such as Earnings per Share, Cash Flow per Share or Book Value per Share and dividing that by the Stock Price per Share.

The calculation is done for each stock in the sample universe, such as the S&P 500 for example. The group is then ranked from cheapest (better value) to most expensive. Then, the universe is divided into groups based on rank- often the cheapest 20% (quintile5), then the second best, etc. with the most expensive stocks found in quintile1. These quintiles are created for each year from the beginning of the data. The subsequent forward 12 months return for each group is calculated and theses returns are aggregated to show an annualized performance record for each quintile. The results of these efforts are subject to rigorous statistical tests to ensure that the factor performance results are not fleeting or explained by some other measure.
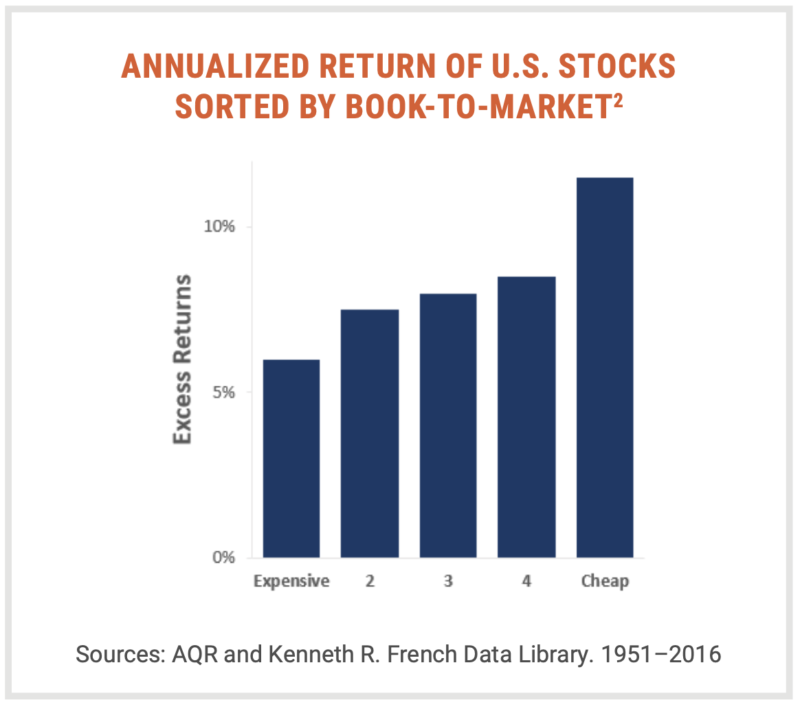
When the average annualized performance of the quintiles is compared to the original universe (benchmark), we see that the inexpensive stocks in quintile5 have the best performance and the expensive stocks in quintile1 have the worst performance. It doesn’t matter which value measure we use- earnings, cash flow or book value- all results show an advantage in the inexpensive stocks versus the market averages and the expensive stocks. Now let’s review how value fits in the five criteria to ensure significance of the results:
PERSISTENCE refers to how probable the performance advantage is across long time periods and different economic conditions. As seen in the table below from Berkin & Swedroe, the Value Factor appears to be quite persistent over 5, 10 and 20-year rolling periods.
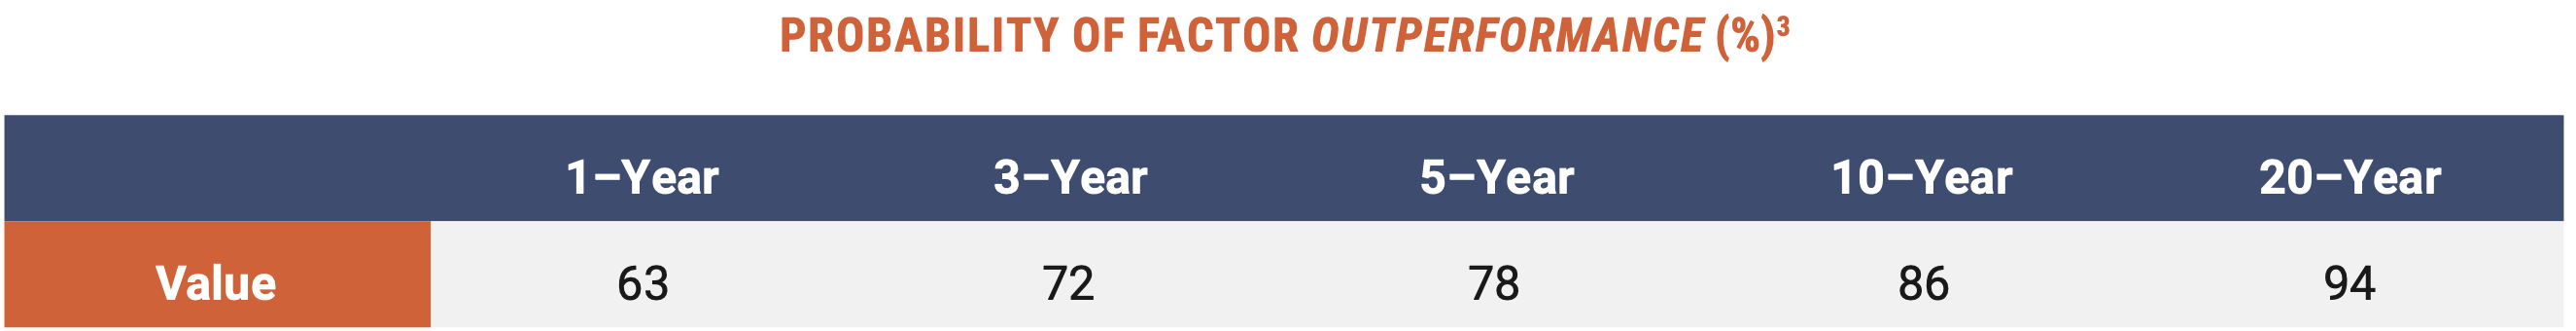
This long-term advantage is a strong endorsement of buying cheap stocks, we should note that the cheap stocks in quintile5 don’t win every year. In fact, they have only won in approximately 63% of the 12-month periods in the past. If we look at longer periods, quintile5 leads in 78% of 5-year periods and 86% of 10-year periods. Thus, the advantage to value stocks is significant and highly probable over time, but not guaranteed.
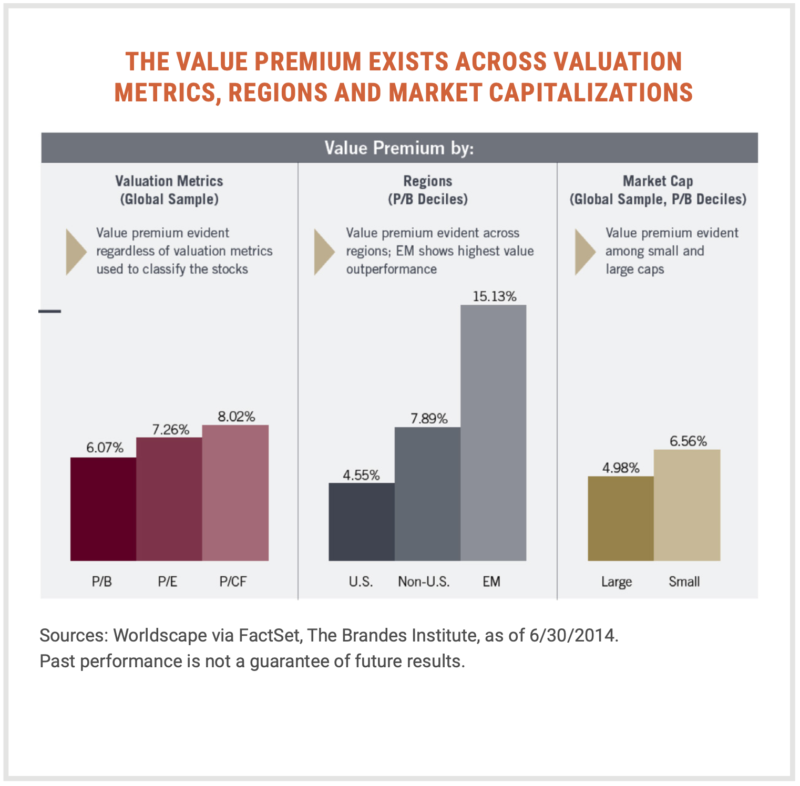
PERVASIVE means that the factor holds across different countries, regions and asset classes. Once again, the Value Factor has shown pervasiveness, as it works in the US and all Foreign stock markets and in asset categories outside of stocks, like bonds and real estate.
ROBUST focuses on the ability of the factor to work in a variety of specific measures. In fact, cheap stocks beat expensive stocks whether we use Earnings to Price, Cash Flow to Price or Book Value to Price ratios to measure value. The adjacent table from a 2014 research study at the Brandes Institute illustrates the Value Factor’s effectiveness. 4
INVESTABLE refers to the practical application: does the Factor’s performance advantage survive when real world costs of trading and implementation are incurred? For the Value Factor, the answer is a resounding yes- due to relatively low turnover in value portfolios and good liquidity in most applications.
The INTUITIVE test is common sense oriented. Are there logical, risk-based reasons or documented behavior-based reason for the factor to exist? In the case of Value, the behavior-based reasons are the strongest. For example, investors consistently make the error of extrapolating past growth when evaluating and pricing stocks, as a result, when the growth trajectory disappoints, the more expensive stocks react dramatically- falling by significant amounts as investors adjust to a less rosy outlook. Robert Hagin, in his book Investment Management: Portfolio Diversification, Risk and Timing- Fact & Fiction, researched the impact of positive and negative earnings announcements versus the consensus earnings estimates. He found that cheap stocks gained more on positive surprise announcements and lost less on negative surprise announcements than expensive stocks.5 When investors are surprised by earnings announcements, cheap stocks get the better end of the resulting stock price reaction. This skewed reaction illuminates one basis for the Value Factor’s performance.
As the first identified and rigorously tested factor, value holds a prominent place in the construction of equity portfolios. Getting exposure to the value factor is relatively easy. Many quantitative funds and ETFs employ systematic value formulas to create their portfolios.
The various ways to measure value present interesting options for HPA’s factor-based approach. Our research points to “cash flow yield” as the best metric for ranking. However, it is complimented by the traditional academic standard of “book value to stock price” and “earnings yield”. Thus, when we build our portfolios, we seek investment across each the measures, but with emphasis on cash flow yield.
From long experience, we know that the Value Factor can go through periods of lagging performance. While these periods have been followed by long periods of robust performance, the periods of “value drought” are frustrating to most investors. For this reason, HPA incorporates additional factors that are negatively correlated to value and therefore can offset these periods of drought. Specifically, the momentum and quality factors have historically shown the ability to shine when value is slumping...and vice versa. The net result is a multi-factor strategy designed to smooth the overall portfolio performance experience while keeping exposure to factors that should provide long term benefit.
1 Securities Analysis: Sixth Edition with forward by Warren Buffet, by Benjamin Graham & David Dodd, original edition 1934, sixth edition 2008.
2 AQR Capital Management, LLC. (2016). Systematic Equities: A Closer Look. Retrieved from https://www.aqr.com/Learning-Center/Systematic-Equities/Systematic-Equities- A-Closer-Look
3 Berkin, A. L., Swedroe, L. E., & Asness, C. S. (2016). Your complete guide to factor-based investing: The way smart money invests today. St. Louis, MO: BAM ALLIANCE Press.
4 Institute, B. (2015). Value vs. Glamour: A Long-Term Worldwide Perspective. SSRN Electronic Journal. doi:10.2139/ssrn.2983985 The Brandes Institute Research Paper No. 2015-01
5 Investment Management: Portfolio Diversification, Risk and Timing—Fact and Fiction, by Robert Hagin. 2003. UCLA professor and former Executive Director of Morgan Stanley Investment Management.
INVEST SMARTER
Call (585) 485-0135 to discuss how a factor-based approach could pay off for you.