Mar 2019
The HPA Factor Series:
Size
Size
Michael E. Jones, CFA
Michael J. Cicero, CAIA

Blue Chips, Red Chips...Large Cap, Mid Cap, Small Cap- most investors understand there is a range of different sizes of public companies. Today, the largest companies have stock market capitalizations (the total number of shares outstanding multiplied by the stock price) approaching one trillion dollars, while the smaller stocks in the public realm sport capitalizations less than $50 million. The largest companies are extremely well known, widely held by investors and heavily researched on Wall Street. In contrast, most investors have heard of only a few dozen of the small cap companies making up the Russell 2000 Index. Long ago, investment strategies began to specialize in stocks of different size. How does the size differentiation matter?
While investment strategies focused on different size companies for decades, the first formal academic study of the differences in risk and return between small and large cap companies was published in 1981.1 Rolf Banz’s research revealed that the returns on small cap stocks were significantly larger than large cap stocks for the period from 1926 to 1975. Other researchers quickly confirmed the findings and the “Size Factor” was born.2
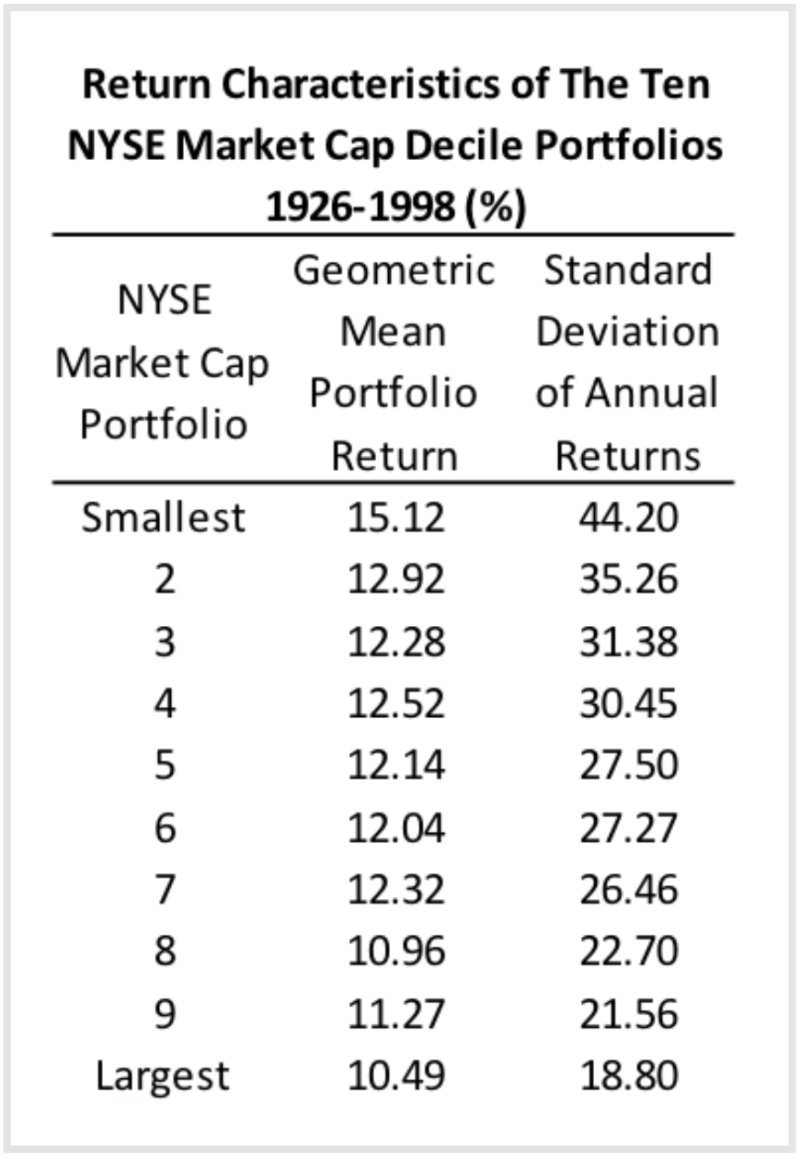
Banz’s study showed that the smallest decile (10%) of stocks listed on the New York Stock Exchange outperformed the largest decile by a whopping 5% annually. Following the publication of this and other studies, such as Marc Reinganum’s “Abnormal Returns in Small Firm Portfolios” (chart to the right), the growing awareness of the opportunity caused many investors to seek small cap investments. Wall Street accommodated them with large numbers of small cap funds. Consultants to institutional investment funds began to recommendspecific allocations to dedicated small cap exposures. Probably as a result of this new popularity, the excess return of small caps shrank in more recent times to approximately 1% (see chart below with returns from 2005 to 2014 below).3
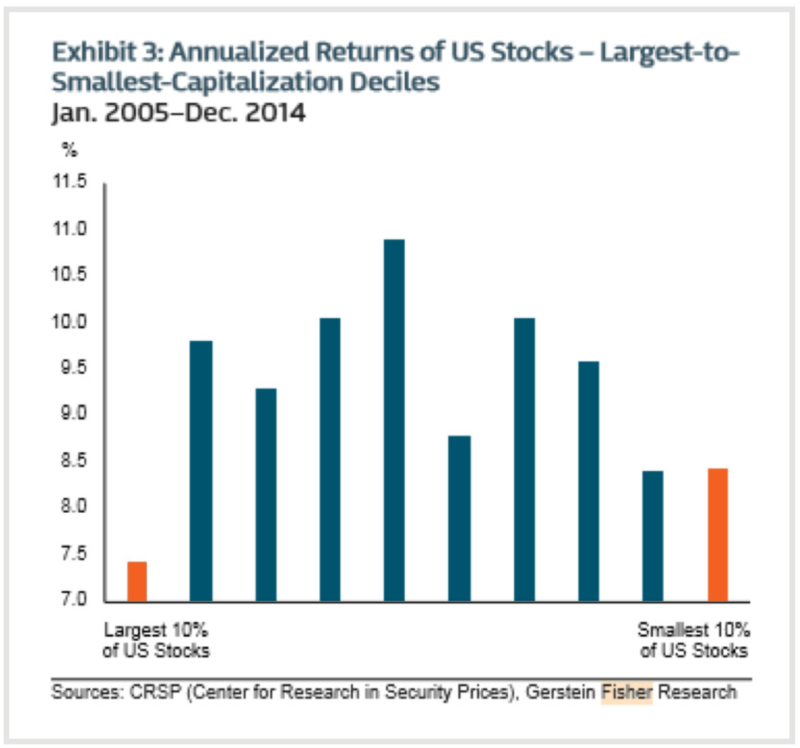
Once you get away from large caps, all the mid & smaller cap groups show better performance. The case for the smallest companies gets significantly better when we control for other factors like quality and value. More on that later in the paper.
Further defining this observation about large cap underperformance is a study from Rob Arnott at Research Affiliates entitled “Too Big to Succeed”.4 Arnott makes the case that the largest companies get to that exalted position of “top dog” by beating their competition. However, this success puts these companies in the cross hairs of government regulators, legal challengers and upstart competitors. To study the impact of “top dog” status, Research Affiliates studied the performance of the largest capitalization stock in each of the twelve broad economic sectors (Consumer Durables, Energy, Healthcare, Finance, etc.) and compared them with the rest of the stocks in their respective sectors. The results were discouraging for the “top dogs”: Arnott reports “In fact, we find the leader in any sector underperforms the average stock in its sector by 3.5% in the next year...and the next year...and the next”. He concluded that investors could beat the performance of the Russell 1000 Index by 1% annually by simply leaving out any stock that had been a “top dog” in the prior 10 years.
Other studies found that “equal weighting” the companies in the S & P 500 Index, instead of “capitalization weighting” also improves returns over time. Equal weighting means that each of the 500 companies counts the same in the index (0.2% each). The regularly quoted S & P 500 Index weights the returns of each stock by their respective total market capitalization. Thus, the performance of the very largest stocks – Apple, Amazon, Netflix, etc.- overwhelms the impact of the results of the smaller companies in the Index. Instead of each stock contributing 1/500th to the Index return (equal weighted), the capitalization weighted index return is heavily impacted by the top fifty companies. Historical performance analysis shows that the equal weighted index has beaten the capitalization weighted index over time. Since reducing the influence of the largest companies and increasing the contribution from smaller companies has been a winning formula for investors over time, we conclude that the size effect is visible here too. Several “Equal Weighted” Index funds are available to investors now, but we believe there are better ways to introduce the size effect in diversified portfolios.
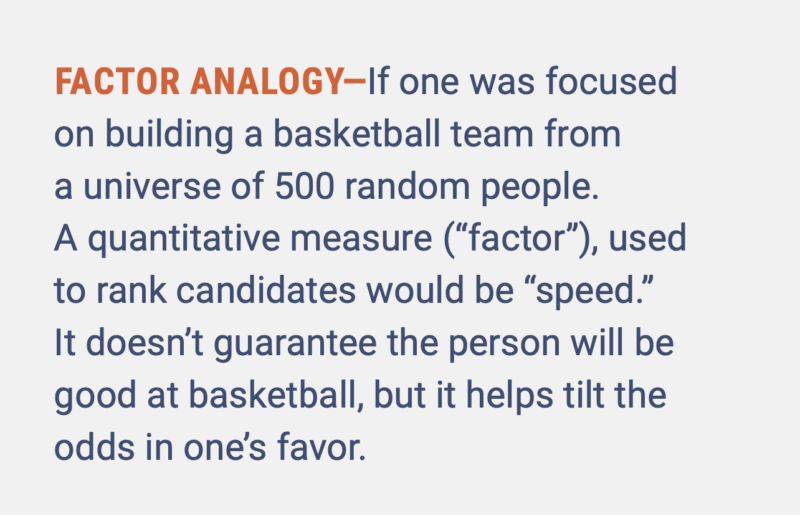
To be worthy of investment, a factor must be persistent, pervasive, robust, investable and intuitive. Now let’s review whether the Size factor satisfies the five tests for significance.
PERSISTENCE refers to how probable the performance advantage is across long time periods and different economic conditions. The table below from Berkin & Swedroe shows that the Size Factor is persistent over a variety of time frames.5

While the probability of outperformance is good, the Size Factor is weaker in this regard than the other factors.
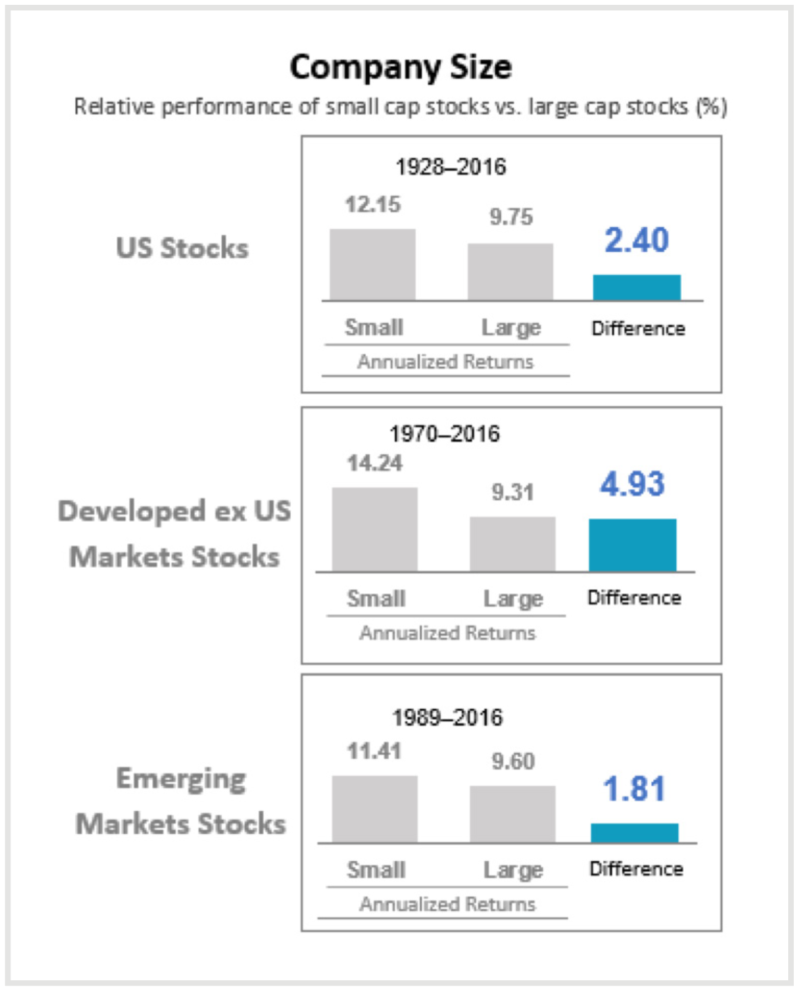
PERVASIVE means that the factor holds across different geographic regions. The Size Factor is observed across world markets as illustrated by the chart from Dimensional Fund Advisors to the right.
A factor is ROBUST if it is observable in a variety of different forms. This is clearly the case for the Size Factor, where we see a performance benefit to mid-caps, small-caps and micro-caps. The Research Affiliates study showed that simply eliminating the very largest stock in each sector had a beneficial impact too.
INVESTABLE refers to the practical application: does the Factor’s performance advantage survive when real world costs of trading and implementation are incurred? Trading costs, including bid-ask spreads and commissions, tend to be lowest for the largest cap companies and steadily higher as you trade smaller and smaller companies. Thus, some of the Size Factor premium could be at risk to transaction costs. For lower turnover and broadly diversified portfolios these transaction costs are manageable. Any small-cap or micro-cap portfolio that has significant active turnover might be suspect in this regard. Mid-cap companies tend to trade at costs comparable to large-caps, so transaction costs are not a problem if turnover is moderate. In all cases, investors need to keep a wary eye on portfolio turnover. However, the Size Factor premium has been reliably captured by many index funds in the small and mid-cap sector.
The Size Factor passes the INTUITIVE test mainly because of the higher volatility that accompanies small stock portfolios. High volatility represents higher risk, which should logically be offset with higher return. Undoubtedly this “risk aversion” influence accounts for much of the premium return to Size.
The Size Factor has been widely documented and implemented by most quantitative investment strategies over the past 50 years. Considering the diminished premium observed over the past couple of decades, a healthy debate exists in the academic world about the ongoing validity of small size.
Has the size premium been eliminated by the flow of money into small caps?
We clearly conclude, given our comments and supporting information above, that the size factor has not “vanished”, but that it appears the premium return has decreased in recent decades as awareness of the factor has grown. While the premium may have diminished, it remains statistically significant. We observe that the reliable factor premiums are supported by risks that cannot be arbitraged away and behavioral influences that will not disappear without a significant change in human behavior. However, the premium returns for all viable factors fluctuate over time, which is why we advocate a multi-factor approach.
In our view, consideration of the Size Factor’s efficacy as a stand-alone factor is less important. What matters most is that in combination with other factors (multi-factor models), size can be an important contributor.
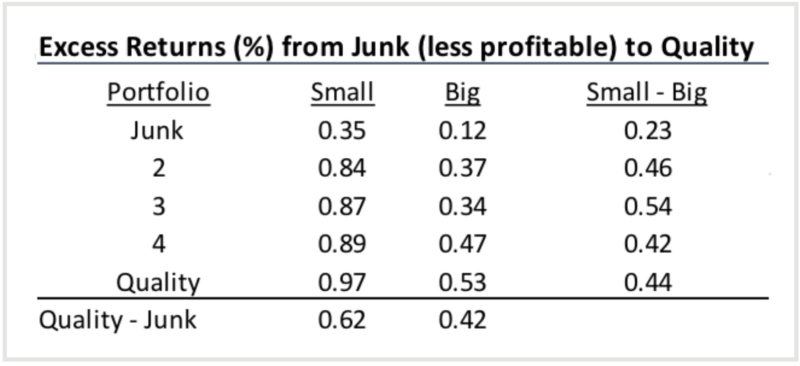
This point is well documented in a research paper from Asness et al. entitled “Size Matters If You Control Your Junk”6, with “Junk” referring to less profitable companies. In this study, Size and Quality factors were combined to create two factor portfolios. The results are shown to the right. Please note that these are monthly returns- multiply by twelve for an estimate of annual return.
We see that “small junk” portfolios provide notably poor returns. However, the Size Factor is observable in all other quality quintiles, with the highest monthly returns found in the smallest size and highest quality portfolio.
A similar impact is seen when we combine Size and Value. McDermott & D’Auria illustrated this in their 2014 study, “What Do We (Really) Know about US Small Cap Investing?”7 They separated the small cap universe into five value ranked quintiles, as seen in the table below.
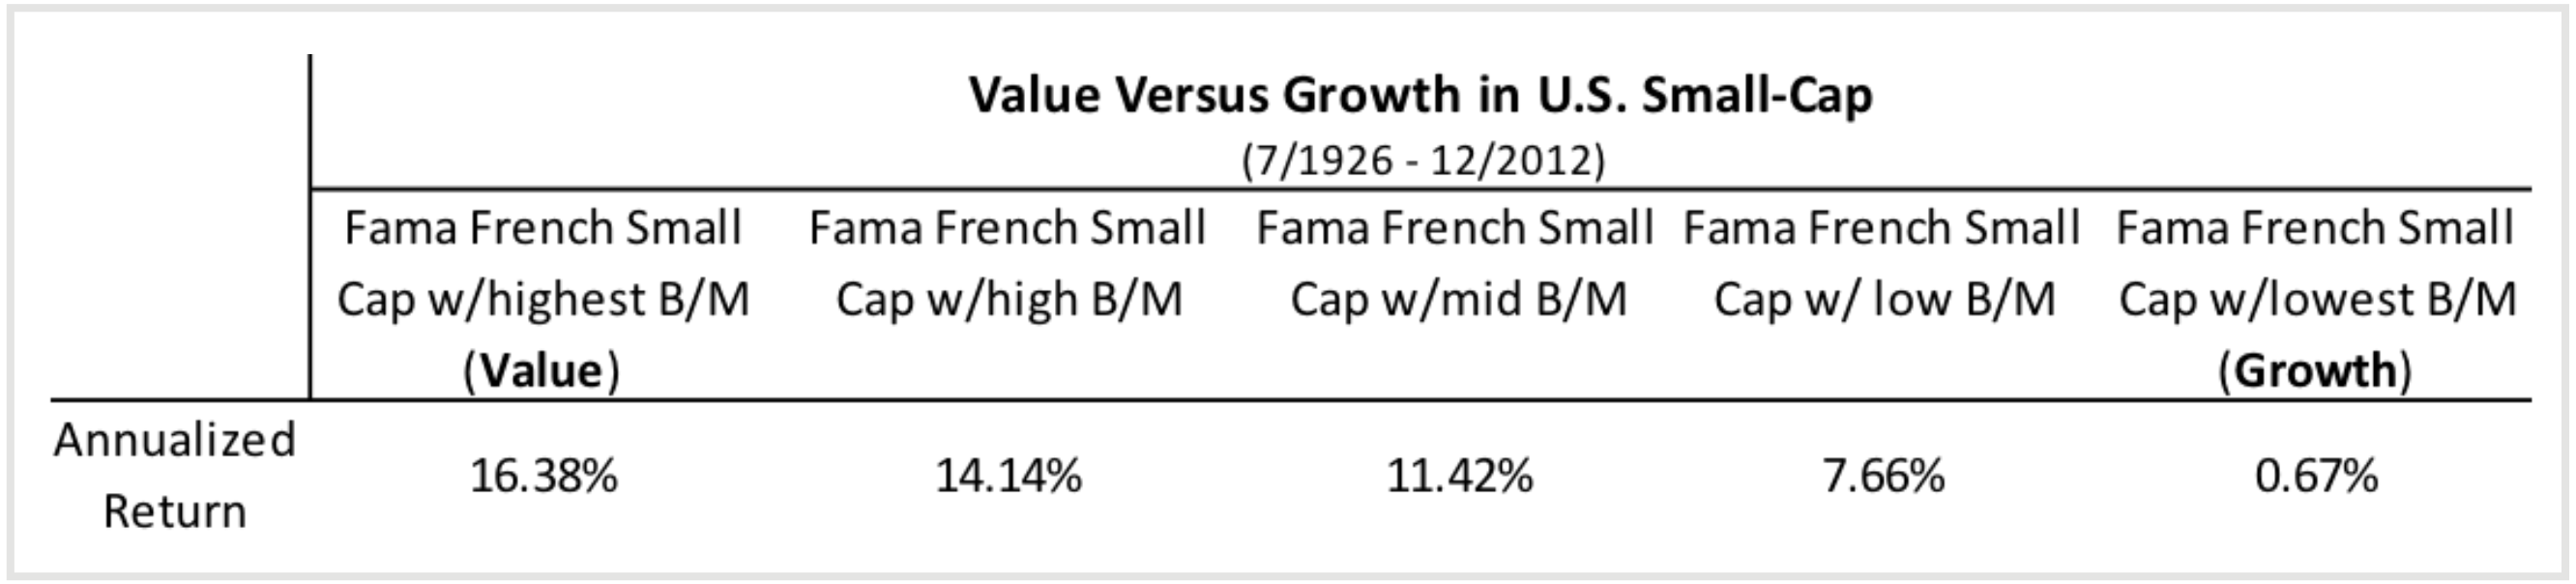
The data shows a dramatic improvement in small cap returns as we improve in value. The authors conclude: “Clearly, all U.S. small stocks are not created equal. Small growth stocks have had relatively poor performance. Of the 25 Fama/French research portfolios that cover the U.S. market, the extreme small growth portfolio has the lowest monthly return (0.72 percent) and highest standard deviation (42.19 percent) over the entire July 1926 through December 2012 period; this also is true in the post-Banz (1976–2012) sub-period. The lack of a strong small-cap premium in the post-Banz period is driven by the poor performance of the extreme small growth firms.6 ” 8
Both studies show that Size does improve returns if we eliminate poor quality and poor value stocks. Why? The answer lies in the behavioral construct called the “lottery effect”. Many people are lured to highly publicized, large potential payoffs in lotteries such that they ignore the poor odds of making a reasonable return on their investment. Buyers of lottery tickets pay way too much for the ticket relative to its true value. The same holds true in the stock market, where the stories of “the next Google” or another tiny marijuana company about to skyrocket get the speculative juices flowing. As a result, investors pay way too much for “lottery stocks” with potential large payoffs. Perhaps the best example of investment logic being overwhelmed by the lure of “lottery stocks” was back in the 1998-2000 Internet stock era. Investments in poor quality and expensive start-up companies seem to offer a potentially enormous reward, but most of these companies don’t work out. The poor returns we see in academic studies for small growth stocks reflect this reality. Successful investors eliminate exposure to small, expensive and poor-quality stocks despite the allure of the rare large payoff.
The Size Factor is an important contributor to multi-factor portfolios. Many of the factor ETFs and mutual funds that we use at HPA are strongly tilted to mid-cap and small cap stocks. This tilt leads to occasional short-term deviation from the performance of the capitalization weighted indexes, but it adds to performance over the long term. Moreover, the size factor is combined with other factors in our holdings, eliminating “lottery stocks” and resulting in better contribution to performance than size on its own.
1Banz, Rolf, 1981 “The Relationship Between Return and the Market Value of Common Stocks”, Journal of Financial Economics, 9 (1): 3-18
2Reinganum, Marc. 1981 “Abnormal Returns in Small Firm Portfolios”, Financial Analysts Journal, 37 (2): 52-56
3Gerstein Fisher. (2015). Sizing Up The Size Premium (Research, pp. 1-4, Research). People’s Securities.
4Arnott, R. (June 2010). Too Big to Succeed (Fundamental Index Newsletter, pp. 1-4). Research Affiliates, LLC.
5Berkin, A. L., Swedroe, L. E., & Asness, C. S. (2016). Your complete guide to factor-based investing: The way smart money invests today. St. Louis, MO: BAM ALLIANCE Press
6Asness, C. S., Frazzini, A., Israel, R., Moskowitz, T. J., & Pedersen, L. H. (September 2018). Size Matters, If You Control Your Junk. Journal of Financial Economics, 129(3), 479-509. doi:10.2139/ssrn.2553889
7McDermott, John B., and Dana D’Auria. “What Do We (Really) Know About U.S. Small-Cap Investing?” Journal of Financial Planning 27 (1): 46–52. 8Ibid, 50.
INVEST SMARTER
Call (585) 485-0135 to discuss how a factor-based approach could pay off for you.