May 2019
The HPA Factor Series:
Quality
Quality
Cole Smith
Michael J. Cicero, CAIA
Michael E. Jones, CFA

What constitutes a “high-quality company”? Among academics and investment professionals, the metrics used to identify quality companies differ. Many financial measures have been researched in the pursuit of a factor premium that “aims to capture the excess return of ‘high quality’ companies vs. the market.”1
In general, “Quality” is reflected in companies with consistent high profitability, a strong balance sheet and low sensitivity to economic cycles. Common measurements include earnings volatility, gross profitability, return on equity, profit margins and debt as a percentage of total assets.2 Each metric produces different results when used to select high quality companies, therefore each group of constituents will have a different overall risk-return profile. For this reason, it is critical for an investor to understand the metric(s) selected to create a factor based mutual fund or ETF.
Since there are diverse interpretations of quality, academic research lacked consensus on the “best” measures until recently. Even Benjamin Graham, the “father of value investing,” had a notion that cheaply valued, high-quality, stocks could provide high returns, but he failed to quantify quality factors. Research on various Quality related factors uncovered excess return using metrics like: accounting accruals (Sloan 1996), low capital spending (Pontiff and Woodgate 2008), earnings persistence, smoothness, and loss avoidance (Dechow, Ge, and Schrand 2010).3 The evidence that the quantitatively defined quality of a company is an important factor within stock selection has been around for decades.
Then in 2013, University of Rochester professor Robert Novy-Marx published research entitled “The Other Side of Value: The Gross Profitability Premium”. This widely acclaimed article showed that ranking companies by gross profitability (revenues minus cost of goods sold, divided by assets)4 was a stronger indicator of excess returns than other earnings or balance sheet metrics. Gross profitability is a relatively simple measurement that is subject to very little accounting manipulation, which makes it easy to apply across diverse industries.
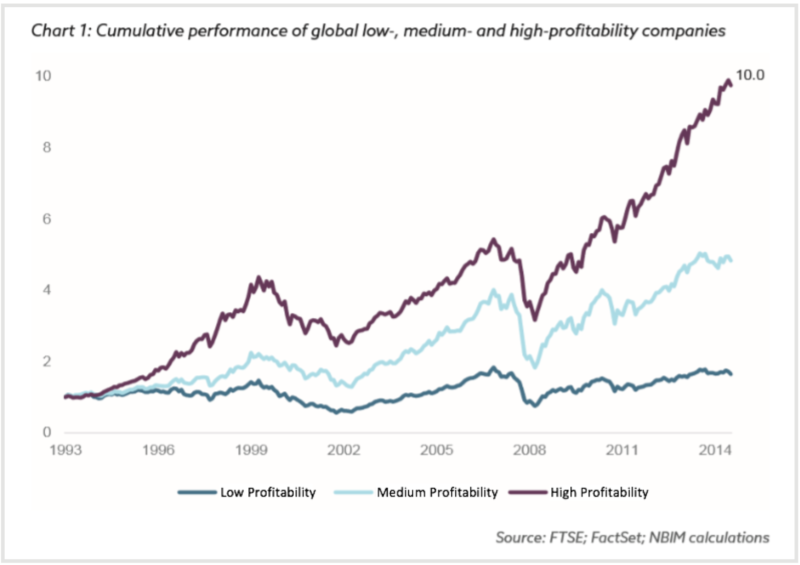
Novy-Marx’s work showed that the stocks with the highest ratio of gross profits (high) divided by total assets, outperformed stocks with lower gross profits (low) as illustrated by this cumulative performance chart to the right by Norges Bank (Norway’s central bank).5 Novy-Marx’s work also revealed that gross profitability produced higher average returns than other Quality metrics.
In their book “Your Complete Guide to Factor Based Investing: The Way Smart Money Invests Today”, Andrew Berkin and Larry Swedroe presented a set of five tests to determine if a factor is appropriate for use in the investment effort. Let’s see how Quality stacks up.
PERSISTENCE refers to how probable the performance advantage is across long time periods and different economic conditions. As seen in the table below from Berkin & Swedroe, the quality factor appears to be persistent over a variety of time frames:2

ROBUST focuses on the ability of the factor to work in a variety of specific measures. There are several definitions and metrics used to quantify “quality.” Research shows that many of these metrics produced excess returns.
“Quality Investing – Industry versus Academic Definitions” by Kyosev et al. (2016) also demonstrated the robustness of the Quality factor across different measurements. The authors divided various quality metrics into two groups; “Industry” definitions (ROE, Profit Margins, Leverage, and Earnings Variability) and “Academic” definitions (Operating Accruals, Net Stock Issues, and Gross Profitability). Their findings showed excess returns from all definitions, but that the academic metrics had “higher predictive power for future stocks returns than the ones used in the ‘industry’.”3
INVESTABLE refers to the practical application: does the factor’s performance advantage survive when real world costs of trading and implementation are incurred? We believe this holds true for the quality factor. The companies with higher quality attributes tend to stay relatively stable, so creating and maintaining the Quality portfolio involves low turnover and low transaction costs. Thus, implementation costs are small and the factor premium survives. Several Quality factor ETF and mutual fund offerings are available to investors, although the number is smaller than other factors due to the relatively recent debut of the factor.
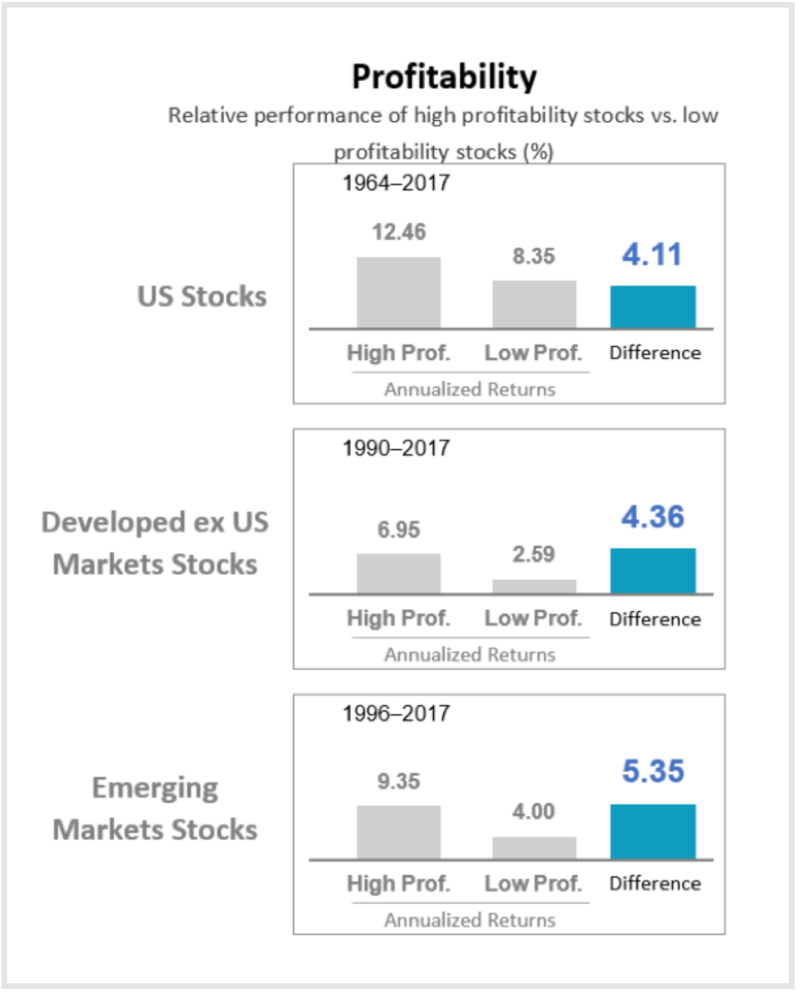
PERVASIVE means that the factor holds across different geographic regions. Excess returns for the quality/profitability factor are observed across world markets as illustrated by the chart to the right from Dimensional Fund Advisors.
The INTUITIVE test is common sense orientated. Are there logical, risk-based reasons or documented behavior-based reasons for the factor to exist? For the quality factor, it’s hard to specify an exact reason for the anomaly but academics have arguments for both sides. One argument for risk-based explanations is that more profitable companies tend to have higher expected future cash flows. Future cash flows create more uncertainty; thus an investor wants to be compensated more for their risk.2
Bouchaud et al. (2016) supported a behavioral explanation stating that “The returns from investing in quality firms are abnormally high on a risk-adjusted basis, and are not prone to crashes. We provide novel evidence in favor of the ‘behavioral view’: In their forecasts of future prices, and while being overall overoptimistic, analysts systematically underestimate the future return of high quality firms, compared to low quality firms.”6 This article’s findings showed that stock analysts tend to place less emphasis on quality metrics, such as operating cash-flows. This underweighting to an important indicator leads analysts to create a “quality” anomaly in price forecasts.
The notion that investors should buy “high quality” companies has been around for several decades. However, the approach to identifying quality was mostly subjective. Only recently has the academic community provided us with objective measures that have been thoroughly investigated and then systematically applied to investment portfolios. These efforts show that the Quality factor is an important contributor to portfolio returns. Our review of the research leads us to believe gross profitability is the most effective way to express quality exposure within our portfolios from the perspective of risk, return, correlation and impact analysis.
While Quality shows attractive excess returns on its own, there are some important additional benefits conferred when Quality is introduced in multi-factor portfolios. In particular, Quality has shown a slight negative correlation to Value and Size in studies of past returns. This means that when Quality is doing well, Value and Size tend to underperform and vice versa. By mixing these factors in the multi-factor portfolio, we should see a ‘smoothing’ of results so that periods of underperformance would be lessened. This is a critical component of risk control.
Mixing these factors can also boost portfolio returns. As shown by Novy-Marx in his “Quality Investing” paper, incorporating gross profitability (Quality) and book-to-price (Value) in the selection of small cap stocks (Size) produced an average annual return of 12.3%.7 If you eliminate the value and size integration, gross profitability’s average annual return drops to 7.10%.
Why does combining Quality measures with Value, result in higher portfolio returns? In our view, integrating these factors helps mitigate the inherent problem of each factor as a “stand alone”. For the Value factor, a portion of the lower valued companies are cheap for a good reason: their business model is flawed or failing. These so-called “value traps” are often weeded out by applying a quality filter. For the Quality factor, a portion of the most profitable companies are extremely popular with investors and thus extravagantly priced such that many years of great performance are already discounted in the stock price. These “bubble” stocks are filtered by adding a valuation metric to the quality portfolio. This combination of finding fairly priced yet profitable companies, helps explain the wide success of the similar strategies used by Warren Buffet and Charlie Munger at Berkshire Hathaway. Quality has an important role in any multi-factor portfolio.
1Bender, J., Briand, R., Melas, D., & Subramanian, R. A. (2013, December). Foundations of Factor Investing.
2Berkin, A. L., Swedroe, L. E., & Asness, C. S. (2016). Your complete guide to factor-based investing: The way smart money invests today. St. Louis, MO: BAM ALLIANCE Press.
3Kyosev, G., Hanauer, M. X., Huij, J., & Lansdorp, S. (2016). Quality Investing Industry versus Academic Definitions. SSRN Electronic Journal. doi:10.2139/ssrn.2794807
4Novy-Marx, R., 2013, The Other Side of Value: The Gross Profitability Premium, Journal of Financial Economics, 108, 1-28
5Norges Bank. (02/12/2015). 03|2015 THE QUALITY FACTOR (Discussion Note, pp. 1-30, Rep. No. ISSN 1893-966X).
6Bouchaud, J., Stefano, C., Landier, A., Simon, G., & Thesmar, D. (2016). The Excess Returns of Quality Stocks: A Behavioral Anomaly. SSRN Electronic Journal. doi:10.2139/ ssrn.2717447
7Novy-Marx, R. (2014). Quality investing. Unpublished Results.
INVEST SMARTER
Call (585) 485-0135 to discuss how a factor-based approach could pay off for you.