May 2020
The HPA Factor Series:
Low Volatility
Low Volatility
Michael E. Jones, CFA
Chief Investment Strategist

Volatility is a measurement of the ups and downs of price movements. Stock prices change because the ever- changing economic conditions impact companies in different ways depending on the nature of their business. Investors react to the news flow by buying or selling based on their view of the future. Some stocks experience more pronounced volatility than others.
The fluctuation of investor expectation is usually related to a specific company’s blend of fundamental earnings stability, growth expectations, stock price valuations and balance sheet strength. For example, a food product company might typically have very stable earnings, moderate valuation due to modest growth outlook, a slightly above average dividend yield and a strong balance sheet. This company’s stock would likely have lower volatility (price movement) than most other stocks as investors’ perception of fundamental changes to this business is muted.
A different example might be a relatively new technology-based company that is not yet profitable but has excellent growth potential. With a rosy view of the future prospects, optimistic investors give the stock high valuations. Changes in the business outlook can cause significant reassessment of the company’s value, both up and down. This company’s stock price is likely more volatile than most stocks.
Each stock’s volatility changes slowly over time. However, at any point in time, we can measure recent past volatility and rank companies on this statistic. Separating all stocks into bins of low, medium and high volatility allows researchers to study the subsequent return and risk characteristics to see how they vary over time. Those stocks with the lowest range of movement are considered “Low Volatility”.
A closely related, second iteration of the volatility phenomena are the “Minimum Volatility” portfolios. The Minimum Volatility (Min Vol) strategy is very similar to the traditional Low Volatility (Low Vol) strategy but differs in its portfolio construction process. As opposed to simply building a portfolio with stocks that have the lowest trailing 1, 3 or 5yr volatility rankings, Min Vol incorporates an additional component, the correlation between the stocks within the portfolio. Through portfolio optimization the stocks are weighted with the goal of minimizing the overall volatility of the portfolio.
The focus on the interaction between stocks will occasionally allow higher volatility companies to enter the portfolio if their correlation contributes to the reduction of the overall portfolio volatility. With a more diverse set of stocks, additional risk mitigation is possible by reducing sector and industry specific biases. The result is a portfolio that has similar low volatility characteristics but improves on other risk measures such as low beta and improved tracking error to the benchmark. At HPA, we utilize the Min Vol strategy to capture these benefits while deploying Low Vol Factor loadings within our portfolios.
In 1972, Haugen & Heins published an article on risk premiums that was among the first to identify the intriguing attributes of Low Vol stocks.1 Numerous other studies have been published through the years and the evidence is well documented.
Research has shown that low volatility stocks- as expected- usually go down less than the market index during subsequent corrections and up less than the market during strong uptrends. A more surprising observation is that Low Vol portfolios have provided higher returns than the market averages over longer periods.2 In theory, lower risk should be linked to lower returns and vice versa. The fact that low volatility assets- not just stocks, but bonds too- perform better than the higher volatility peers does not fit well with bedrock academic theory called the Capital Asset Pricing Model (CAPM). Yet it is observed in markets around the world.
While various academic research supports the long-term premium delivered by a Low Vol strategy, those critical of the factor have pointed in other directions.
Recent research from Robert Novy Marx and others
suggests that most of the performance benefit is associated with eliminating the so-called “lottery stocks” from the portfolio, since those stocks on average generate higher risk and lower returns.3,4 Once those stocks (highest quintile volatility) are removed, the rest of the premia from the Low Volatility factor goes away. Researchers theorize that the “lottery stocks” are chronically priced too high for a variety of reasons, including the difficulty in shorting these stocks and the behavioral bias toward overconfidence. Thus, they show poor returns and high volatility.
Driessen and Beilo published a paper in 2016 that studied the influence of interest rates on Low Volatility stocks. Their work shows that declining interest rates are a boost to low volatility stocks, while rising rate environments are a headwind. The authors concluded that interest rate changes are a partial explanation for the low volatility anomaly. They estimate between 20% and 80% (depending on the methodology chosen) of the Low Volatility performance premium is driven by interest rate changes.5 We note that Low and Min Vol portfolios contain many stocks like utilities and high dividend yield stocks, so it makes sense that they have sensitivity to interest rates. Thus, the returns of Low Volatility factor during periods of falling interest rates and (1982 to present) may be overstated.
The conclusions reached by Novy Marx, Driessen and Beilo deserve consideration. However, we believe the points do not reduce the attractiveness of utilizing the factor, but they do guide our application.
While there is historical evidence of premium returns from the Low Vol and Min Vol factor, we do not use this factor for this purpose. Instead, we use “Min Vol” primarily for its well- established capability of reducing risk (volatility and beta) while preserving reasonable exposure to market returns.
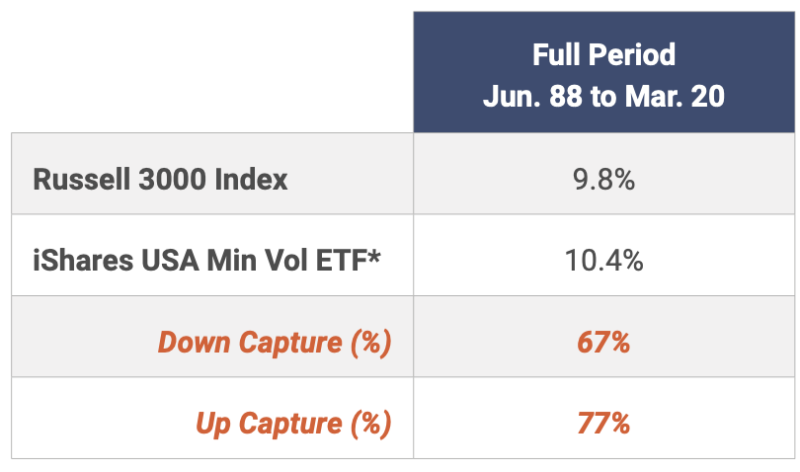
How do we evaluate the risk reduction? One way is “downside and upside capture” which measures the typical percentage change a specific portfolio makes during broad market moves in either direction. If during market corrections of 10%, the portfolio declines only 7% on average, you have “downside capture” of 70%. If during market advances of 10%, the specific portfolio advances 8% on average, it has “upside capture” of 80%. This example is close to the typical historical movement observed in Min Vol strategies. Of course, these are averages over time and we should expect that each individual period of ups and downs will have somewhat different outcomes. However, the Min Vol factor has demonstrated both a desirable pattern of returns and a favorable total return over time.
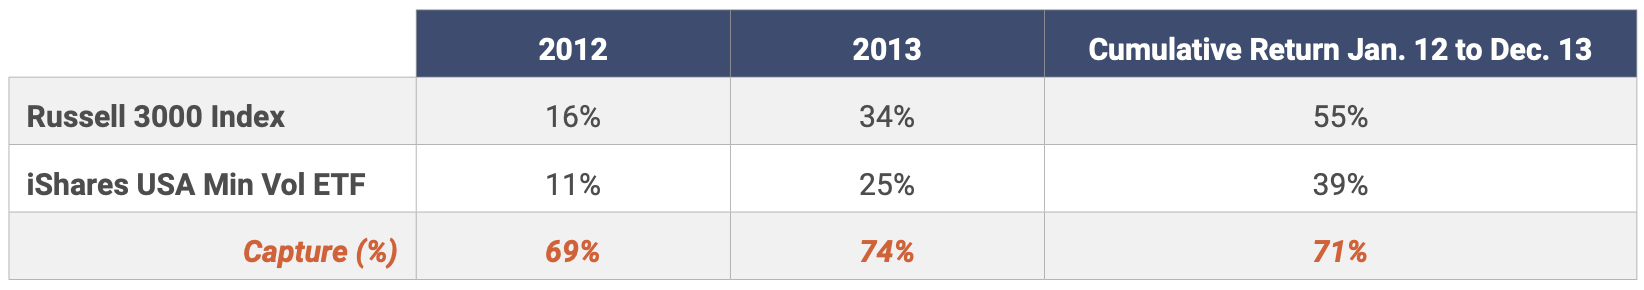
The downside of utilizing the Min Vol strategy comes during prolonged bull markets. Since this factor falls meaningfully short of the market index returns during such periods, it may be difficult for investors to stay the course. As seen in the 2012-2013 experience, most investors would be very disappointed with the relative shortfall during rising stock markets. Turning away from Min Vol at the end of 2013 would have been a costly mistake as it outperformed by 2.3% per year for the following 6 years.
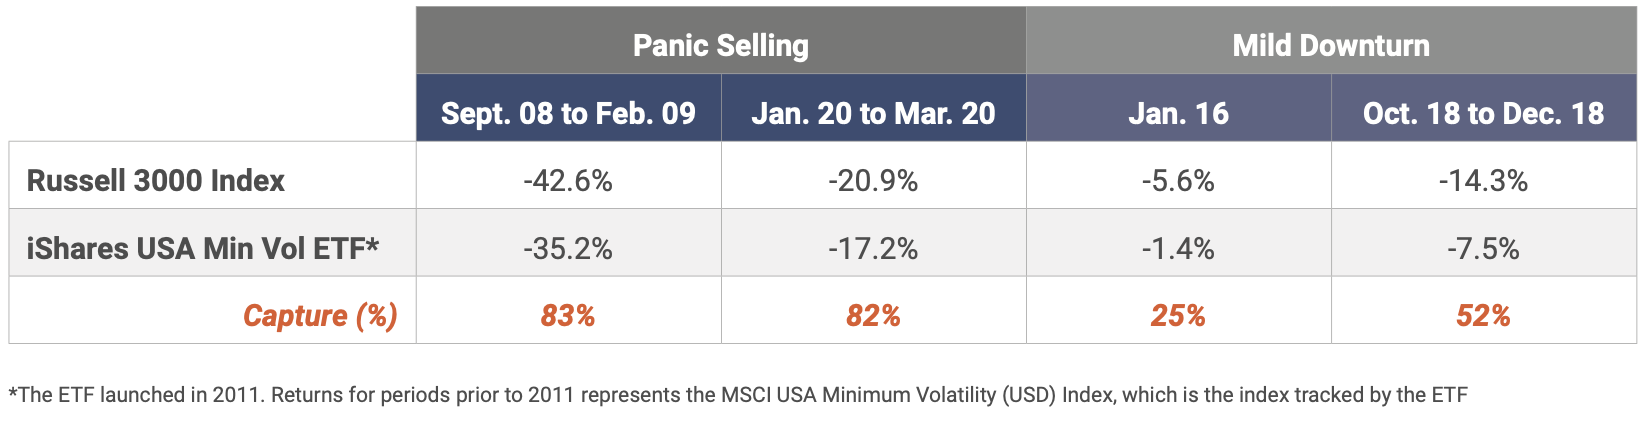
Also, historical data shows that the Min Vol strategy doesn’t always reduce downside capture as much as suggested by the long-term data. This is particularly true during panic driven selloffs such as March 2020 or the fall of 2008. This table demonstrates that our preferred minimum volatility holding, iShares USA Min Vol (USMV), has provided lower downside capture in most market drops, but the protection is somewhat muted in the panic stage. There is an apt saying, “During a panic, all correlations go to 1.0”...which means that panicked sellers are tossing out everything without regard to fundamentals and therefore most stocks act the same. In short periods, the fundamentals don’t matter- but they do over time.
Minimum volatility portfolios provide a valuable tool to modify risk exposures for our clients without sacrificing much, if any, total return over the long term. We alter the percentage exposure to Min Vol within our portfolio strategies to reduce volatility to fit a particular client desire for risk and return balance. “Risk Focused” portfolios have high exposure while “Risk Adjusted” have moderate exposure. Other factors are used to capture premium returns, but the risk modification offered by Min Vol (along with asset allocation) is a key ingredient in managing the risk/return profile for each client.
1Haugen, Robert A., and A. James Heins, (1972) “On the Evidence Supporting the Existence of Risk Premiums in the Capital Markets”, Wisconsin Working Paper, December 1972
2Blitz and Van Vliet. (2007) “The Volatility Effect: Lower Risk without Lower Return” Journal of Portfolio Management 34(1)
3Robert Novy-Marx, “Understanding defensive equity”, University of Rochester and NBER March, 2016
4Turan G. Bali, Stephen J. Brown, Scott Murray and Yi Tang. (2017) “A Lottery-Demand-Based Explanation of the Beta Anomaly” Journal of Financial and Quantitative Analysis 52
5Driessen, J., Kuiper, I. and Beilo, R. “Does interest rate exposure explain the low volatility anomaly?” (September 4, 2016)
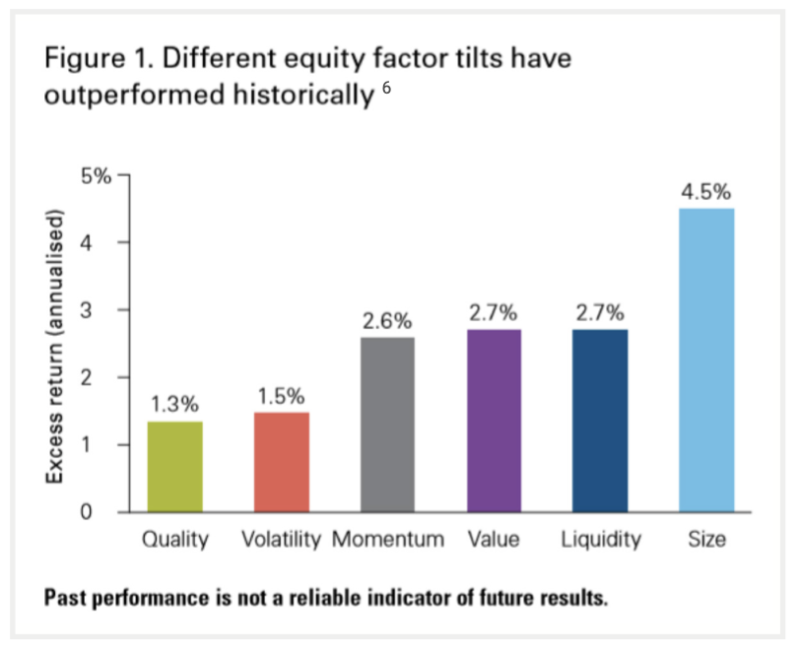
6Douglas Grim, Scott Pappas, Ravi Tolani, and Savas Kesidis, Equity factor-based investing: A practitioner’s guide (June 2016), Notes: Excess returns are calculated relative 10 the MSCI World Total Re1urn Index (USO). All results are as at 30 September 2016. MSCI World Momentum Index (USO) history begins 31 May 1973: MSCI World Value Index {USO) is from 31 December 1974 10 30 November 1997 and MSCI World Enhanced Value Index thereafter. MSCI World Quality Index (USO) begins 30 November 1975: MSCI World Minimum Volatility Index {USO) begins 31 May 1988: MSCI World Small Cap Index IUSDI begins 31 December 2000: and FTSE Developed liquidity Factor Index {USO) begins 30 September 2001. Sources: Vanguard calculations, using data from Thomson Reuters Datastream. MSCI. Bloomberg, and FTSE.
INVEST SMARTER
Call (585) 485-0135 to discuss how a factor-based approach could pay off for you.