Mar 2023
Tax Costs and Fees: A High Hurdle for Active Mutual Funds!
Michael J. Cicero, CAIA
Director of Portfolio Research and Management

In our inaugural paper, “Tip of the Iceberg,” we examined the impact of fund fees and tax costs. We found the claim by active managers that “performance would overcome fees and tax” was simply false. In fact, our results showed that in 2021, gross performance alone failed to meet the benchmark by a large margin. The most startling highlight was that, on average, tax costs were twice the size of the drag from internal fund fees, even though the latter has received most of the attention historically.
As we revisit this crucial topic, the “mass” below the surface remains for active mutual fund investors! It’s been a year since we released “Tip of the Iceberg” and the combination of fund fees, tax inefficiency, and performance continue to negatively impact the industry.
The results of our analysis through year-end 2022 show striking similarities to 2021. Although, this time around the results focus on a 12-month period when most investors lost money. It is safe to say, investors are far more forgiving when costs like these are paid out of profits than when their portfolios finished the year at lower levels than they started.
• INTERNAL FUND FEES, the visible portion of the iceberg, continued to face downward pressure going from an average of -0.65% to -0.58%. Still much higher (by a multiple of 10) than their passive brethren but moving in the right direction for investors. Fee awareness continues to have a significant impact.
• TAX COSTS IN 2022 AVERAGED -0.91%, over 50% larger than internal fund fees! The down market in 2022 represents an environment that should be a tailwind to tax efficiency - this might be as good as it gets!
• PERFORMANCE analysis at first impression shows “protection” offered by active managers during the recent volatile market correction, with returns falling less than relevant benchmarks. The average outperformed (gross) the benchmark by +1.04%, returning -17.36% versus -18.40%, respectively.
• NET RESULTS: once performance is adjusted for the average fund fee of -0.58% and tax cost of -0.91%, the outperformance of +1.04% erodes quickly to underperformance of -0.45%. To put this in dollar terms, an investor with a $1,000,000 portfolio value on Jan 1st 2022, lost $173,600 from investment results, $5,800 from the fee they paid and still had to reach in their pocket at the end of the year to pay nearly $9,100 in taxes!
Measuring performance net of fees and tax costs is essential! Despite being a better year for active managers based on gross performance, 2022 was yet another year when most investors would have been better served by a passive or factor strategy in an ETF structure.
Included below is a deeper dive into our findings for tax year 2022.
The good news is that internal fund fees charged by active managers have continued to fall. The bad news is that they are still 10x larger than the passive equivalents.
The “internal fee” deserves all the attention it has received across media outlets, publications, and academic papers. Mandated transparency from regulators and decreased costs through technological advancements opened the door for change. Competitive pressure among active managers, investors moving in mass to passive index funds, and the onset of factor-based strategies has accelerated fee compression across the industry...much to the dismay of the first category of fund managers!
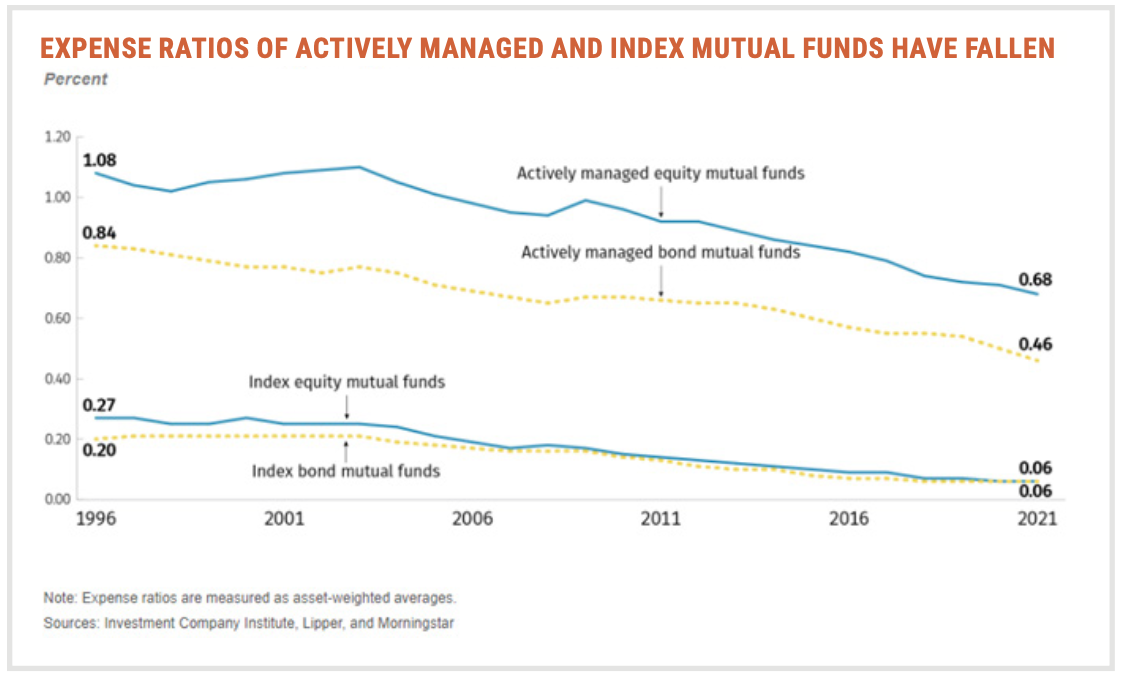
Thankfully, investors are now aware higher fees will significantly stunt longer-term growth and are taking advantage of low- cost options that are widely available. I have included the 25-year internal fund fee trend line above with averages as of the end of 2021 bolded on the right. In 2022, internal fees fell from an average of -0.65% to -0.58% for the Top 25 largest active mutual funds. As the graph helps to illustrate above, while fees from this group continue to fall, they are still multiples of the average fee charged by a passive index fund. The differential creates a natural hurdle rate for active managers which is far from insignificant!
• If you still see high fee funds in your portfolio, find an unbiased professional to analyze your account. Remember to look for 12b-1 and front loads, in addition to just the management fee. At this point in the revolt against fees, higher cost funds are likely indicative of other problems that exist in your portfolio!
• If you find your fund fees are reasonable then you should evaluate tax cost, which exists just below the surface.
The good news is that tax costs were less in 2022 than 2021. The bad news is that an investor in a top 25 active mutual fund paid -0.91% of the investment’s value in tax costs during a down market environment that should have created plenty of opportunity to boost tax efficiency. This may be as good as it gets from a tax perspective for this group of active managers!
Unfortunately, the costs generated by tax inefficiency can be larger than the explicit internal fund fees discussed above! The problem is these costs are difficult to identify and can be easily ignored or even disguised by a financial advisor with conflicting interests. Most investors are completely blind to the impact of tax costs on long-term wealth creation. The promising development is that awareness is slowly building, much like it did for fund fees in the past. Some of the catalysts being, regulators like the SEC requiring generic after-tax results in the fund documents, analytic providers like Morningstar building after-tax performance platforms, and some of the major custodians offering access to after-tax performance calculators.
As a reminder, there are a couple generalizations that can be made about the tax efficiency of active mutual funds:
1. Mutual funds are less tax efficient than ETFs due to the structural differences which require mutual funds to distribute gains on an annual basis.
2. Mutual funds expose the investor to co-investment risks such as receiving a capital gain tax bill without taking part in the actual gain. New investors buy in at the Net Asset Value which includes the capital gains. As those gains are realized by the fund manager’s trading activity, the new investors will get the tax bill for them even though they did not participate in the gain.
3. Active stock picking strategies that attempt to exploit price inefficiencies and/or time market movements tend to make larger trades more frequently. As a result of this higher turnover, they are typically less efficient than passive or factor-based strategies.
In a year with markets down over 18%, instead of maximizing realized losses that could be harvested, the Top 25 largest active mutual funds distributed capital gains. The gains passed through to investors translated to an out-of-pocket cost in the range of 0% to -2.32% of the total position value. The average cost across the group was -0.91%.
The good news is that in 2022 more active managers beat the benchmark (gross of fees and taxes) than in the past. The bad news is that the odds of picking a manager that outperformed the benchmark were no better than a coinflip.
Active investment managers, whose business is “picking stocks,” often claim protection from the downside during difficult market environments. The message obviously gets louder during periods when active manager underperformance grows. Active managers have had a difficult decade. To put this in perspective, according to S&P’s semiannual SPIVA report, which tracks active manager performance against their benchmark over the last 10-year period through December of 2022, over 94% of all domestic active managers underperformed their benchmark.
That figure drops to 51% if we only look at the calendar year 2022. Keep in mind that still means over half of these funds underperformed. This was a good year in a sea of difficult periods and still your chances of picking a winning active manager were no better than a coin flip.
This trend held true in 2022 for the Top 25 active mutual funds we analyzed for this paper. On average, the group outperformed their benchmarks gross of fee and tax by 1.04%, returning -17.36% versus -18.40%, respectively.
Interestingly, the average static cash holding across the group for 2022 and years before is over 4%. This means that roughly 0.70% of the 1.04% “outperformance” can be attributed to their default cash buffer. My guess is the rest and then some is due to static factor exposures (e.g. a tilt towards value stocks, quality stocks & low volatility stocks) and not stock picking skill...but we’ll leave that discussion for an upcoming paper!
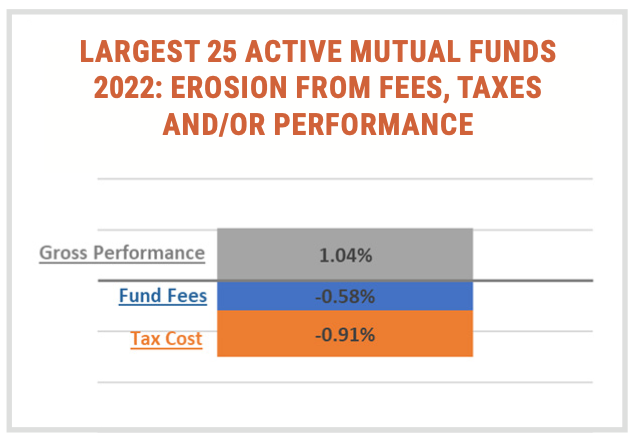
No. It is clear from our analysis that the active funds, on average, lost -0.58% from fund fees and -0.91% from tax cost, instantly transforming outperformance of 1.04% to underperformance of -0.45% net of fees and taxes, generating a total loss for the year of -18.85%
To put this in dollar terms, an investor with a $1,000,000 portfolio value on Jan 1st 2022, lost $173,600 from investment results, $5,800 from the fee they paid and still had to reach in their pocket at the end of the year to pay nearly $9,100 in taxes!
2022 results should again point investors in the direction of passive or factor-based ETFs. Active managers, especially those utilizing mutual fund vehicles, have structural barriers that will prevent them from consistently producing performance that can match, no less beat, the benchmark after adjusting for fund fees and tax cost. Active stock pickers, in general, will:
1. trade more frequently and will have larger research teams adding to tax inefficiency and cost, respectively
2. are likely using a mutual fund structure which are more expensive and distribute the majority of capital gains each year
3. have business interests that lead them to ignore tax efficiency in favor of squeezing every drop of return in their quest to receive top performance rankings.
This, of course, all assumes that their primary value proposition, picking individual stocks that will outperform the market, is in fact a viable goal to pursue in the first place. A plethora of research would suggest that after deducting fees outperformance is extremely unlikely. To question that proposition, one does not have to look much further than the SPIVA statistic showing 94% of active managers underperformed over the last 10 years and 95% over the last 20 years.
The benefits of ETFs over actively managed mutual funds for taxable accounts are not just theoretical, they are playing out in taxable portfolios every day. The foundation of your investment strategy should be built with your best interest in mind, which includes using the fee and tax advantages of ETFs for your taxable portfolios.
Here are the action steps to make your taxable portfolio more efficient:
1. Review your performance net of internal fund fees and taxes. The typical quarter-end or year-end performance reports will not include after-tax figures, although if it improved your performance, I bet it would! The prospectus for any mutual fund can be found with a quick google search. Once you locate the prospectus, search for the term “tax” in the document and it will bring you to a table with pre-tax and after-tax returns. This will allow you to get a sense of the overall tax efficiency.
2. Request the use of an investment approach that falls into the passive or factor-based categories, both of which trade less frequently and in smaller amounts, which significantly improves tax efficiency. Internal fund costs will be drastically reduced as well.
3. Encourage your advisor to invest in ETF structures instead of mutual fund structures. ETFs are considerably more tax efficient due to the mechanism through which gains/losses are realized. This process defers most tax payments until final liquidation.
HPA was built on the tenets of minimizing costs and maximizing tax efficiency while delivering evidence-based investment strategies. Please contact us if you would like us to analyze the cost and tax efficiency of your current portfolio. You’ll be interested to learn what we are able to uncover.
INVEST SMARTER
Call (585) 485-0135 to discuss how a factor-based approach could pay off for you.