

Microsoft’s CoPilot Ai system defines Artificial Intelligence (Ai) as “the simulation of human intelligence by machines, especially computer systems. It involves using algorithms and models to enable computers to perform tasks that usually require human intelligence, like learning, reasoning, problem-solving, perception, and language understanding.”
Data science and machine learning are branches of artificial intelligence. According to CoPilot, “Data science is like the toolbox that gathers, cleans, and analyzes data, whereas machine learning is a technique within that toolbox where algorithms learn from data. Imagine AI as the grand master plan, data science as the treasure map, and machine learning as the X that marks the spot.”
Machine learning focuses on creating systems that can learn from data, identify patterns, and make decisions with minimal human intervention. Essentially, it’s about teaching computers to learn from experience, much like humans do. This is done through algorithms that improve themselves over time as they process more data.
THE Ai EVOLUTION
Artificial intelligence is a dominant topic today. Massive amounts of capital and human effort are being invested in hopes of creating systems that are better at doing complex tasks than humans. While the current fascination is intense, the building blocks of this evolving field have been around quite a while.
The notion that machines could replace or improve human endeavors started with the ancient development of levers, wheels and pulleys. There was an acceleration during the industrial revolution. However, these applications mostly require human operators to provide the smarts. The computer age brought the development of software that can design buildings, read an x-ray, write computer code and play chess. These are narrow applications of artificial intelligence: expert systems that function well in specific tasks. Today, excitement is building on the next leap to “general artificial intelligence” where machine learning is joined by human like perception, reasoning and problem solving.
There is much to know about Ai and the potential applications span a broad range of potential uses. Of course, investing strategies are the focus of our interests; plenty of Ai research is going on here. Given the importance of the topic, we will share our observations to help with context and understanding. Our investment team is dedicated to understanding these fields, following new developments and distilling the knowledge base to deliver what we judge to be optimal investment portfolios for our clients.
DATA SCIENCE
Gathering and analyzing data is the root of informed decision making. Once humans started keeping records of data, data science was born. Organizing data into related bunches allows us to look for trends that may persist and be useful in anticipating the future.
Data Science efforts by investment professionals go back well over 100 years. One of the first investing “algorithms” that I learned was in the book “Security Analysis” written in 1934 by Ben Graham and David Dodd. This book laid the foundation for Value Investing. The authors describe investment selection techniques (an algorithm) based on buying companies whose stock price was trading at less than their net working capital per share (a financial ratio derived from a company’s balance sheet).
Value investing was an early and well-known application of data science. Using public company financial reports, researchers could calculate objective, factual stock price ratios on several meaningful measures, such as book value, earnings and cash flow per share. The universe of stocks could be ranked from least expensive to most expensive based on these ratios, then the list could be divided into ranked portions of the list (for example, cheapest 20% to most expensive 20%, a sort into five quintiles) and the stock price performance of the five quintiles in the next 12 months could be observed. Doing this type of analysis over the course of many years let us know if there is a difference among the various groups in the level and persistence of stock price returns based on these ratios.
The data found on corporate balance sheets and income statements are key to many investment decisions. Studies of this information led to discovery of the Value factor and Quality (Profitability) factor. Stock price data – historical and current was studied and resulted in the identification of the Price Momentum factor and Low Volatility factor. Analysis based on capitalization relative to other slices of the market resulted in the Size factor.
While the data shows that each of these factors individually have produced market beating returns over the long term, there are many short-term periods of underperformance too. Putting the factors together is helpful in smoothing portfolio performance. Much of our effort at HPA is focused on optimizing the factor mix. Data science in the form of correlation analysis is at the heart of this effort.
We are overwhelmed with data. Computers can help us transform data points into usable information through pattern recognition. As described by Microsoft’s CoPilot “Machine learning is a subset of AI that focuses on creating systems that can learn from data, identify patterns, and make decisions with minimal human intervention. Essentially, it’s about teaching computers to learn from experience, much like humans do. This is done through algorithms that improve themselves over time as they process more data.”
For most of the history of data science’s application to finance and investing, the humans directed the algorithms. Some professor or portfolio manager would postulate “this information should impact stock prices” and then collect data to measure whether the relationships they expected could be seen in the past.
As computing power improved, more and more data could be “mined” to test as many potential relationships as possible, but a human was always the one deciding what information to use when making an investment decision in decades past. The inevitable next step was machine learning, with the computer algorithm making its own decision of what information to use and how to use it in investment decisions as the amount and types of data became increasingly complex.
For a simplified example, assume we train our computer software to analyze one variable- oil price change- for impact on various factor portfolio performance over the next six months. Assume the analysis shows that oil price increases of 5% or more during a 4-week period are followed by value portfolio outperformance 65% of the time during the past 30 years. So, it looks like we have an actionable piece of information. The machine (computer) has learned that oil price change has a persistent effect on the value portfolio’s relative performance.
In our simplified example, the computer (machine) could create an algorithm (decision rule) in which whenever oil prices rise by 5% in four weeks or less, their investment portfolio automatically switches to a value portfolio. Algorithmic trading has been around a long time, with plenty of success. Our machine learned algo example should yield successful returns also.
However, note that in our example, only 65% of the time does that trade work. The trade is a loser 35% of the time. This is true of many correlational relationships in investing. Nothing works all the time. Since computer driven trades are rapid and unchecked, when the decision rule is applied in certain circumstances, the consequences can be catastrophic. Therefore, machine learning algorithmic trades need some risk management “guard rails” to limit damages.
My first exposure to a computer driven problem occurred in the Black Monday 22% market crash in October 1987. When this largest one-day market crash in history happened, we all assumed that something terrible must be the cause. However, as time went by, there was no recession, no terrible financial news. So, what caused the crash?
The best guess is that the new but popular “portfolio insurance” programs that were supposed to cap the losses of big institutional portfolios were the culprit. These trading algorithms sold S & P 500 futures contracts when certain circumstances arose. When one algo trading program sold lots of futures, it tripped other algo programs that were sensitive to market declines. The programs caused a circular selling frenzy for large caps. Less than 2 years later, the stock market recovered its loss and moved on to higher ground, with no explanation for the Black Monday disaster.
Another famous algorithmic faux pas was the “Flash Crash” that occurred May 6, 2010. That day, the stock market declined by almost 10% in 36 minutes. The decline was triggered by a large sale of S & P 500 futures and accelerated by High Frequency Trading algorithms that piled on additional sales. It was also discovered that a British trader, Navinder Singh Sarao, used “spoofing” algorithms to rapidly place then cancel large orders, which increased market instability. Within the hour, a rebound was underway, and the market mostly recovered by the end of the day’s trading. However, some investors were saddled with large losses as the algorithm ran amok.
The bond market has experienced some algo collapses too. Perhaps the most famous was the implosion of Long-Term Capital Management in September 1998. This hedge fund was run by an all-star team of Nobel Prize winning economists. However, their trading strategies used a large amount of borrowed money for their investments (known as “leverage”).
When their strategy went awry in an unusual bond market environment, the leverage caused their collapse and required a $3.6 billion bailout, engineered by the Federal Reserve to avoid a large financial crisis.
In all cases, we should remember that machine learned data analysis pointing to causative relationships is not a sure thing. They may work most of the time, but you still need to account for probability. Invest in favor of high probability outcomes but be prepared for the occasional low probability event. (There might be a cool name for an investment firm in this bit of wisdom…)
Machine learning has gone way beyond simple two variable models. Today’s high-power computers can scour large numbers of data categories in search of correlations and predictive relationships. Our world is complex and ever-changing. According to IBM, 90% of all data in existence has been created in the past two years.* There is much to discover! Keeping up with complexity, change and the sheer volume of new data is a challenge, even for supercomputers.
Quantum computing, which reaches beyond the limits of classical computing and traditional mathematical constraints, has the potential to transform AI by exponentially increasing computational power, allowing algorithms to process and analyze vast data sets at unprecedented speeds. This boost will enable more complex problem-solving and pattern recognition, essential for advancing machine learning models and real-time data analysis. With quantum computing, AI systems can explore multiple outcomes simultaneously, improving accuracy and expanding the scope of predictive capabilities.
From Data Science, the jump to Machine Learning required the computer to search for and identify patterns in data that can be reliably exploited. However, the machines were pointed in the right direction by their programmers. The computers were “trained” on specific data. The jump to Artificial Intelligence requires computers that can learn, reason and problem solve on their own. True Ai suggests that the computer system should be allowed to think for itself, with fewer constraints.
There are some investment funds that boast Ai as their core function. Perhaps the best known is the Amplify AI Powered Equity ETF (AIEQ). The ETF was launched in 2017. The Fund investment manager is EquBot, Inc. whose website boasts of a team with “more than one advanced degree per person from a list of the leading computing program universities, such as Berkeley, MIT, Harvard and Stanford” and more than 20 years of experience in machine learning applications.** EquBot’s team uses the IBM Watson Supercomputer to analyze “more than one million data points every day… on over 6000 US companies, technical, macro, market data and more.” Pretty comprehensive! The Watson Supercomputer itself is a product of several decades of research.
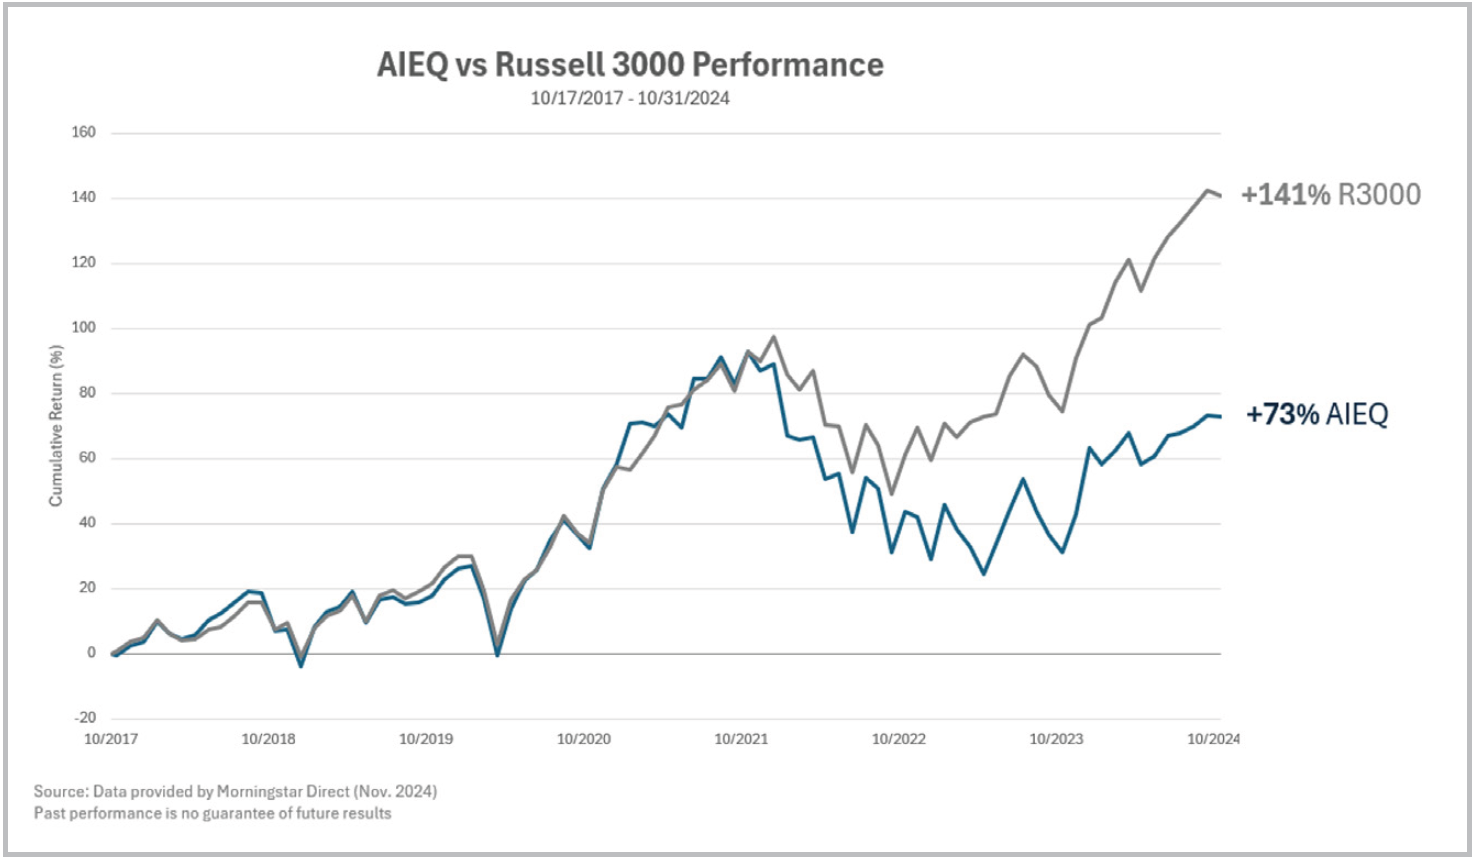
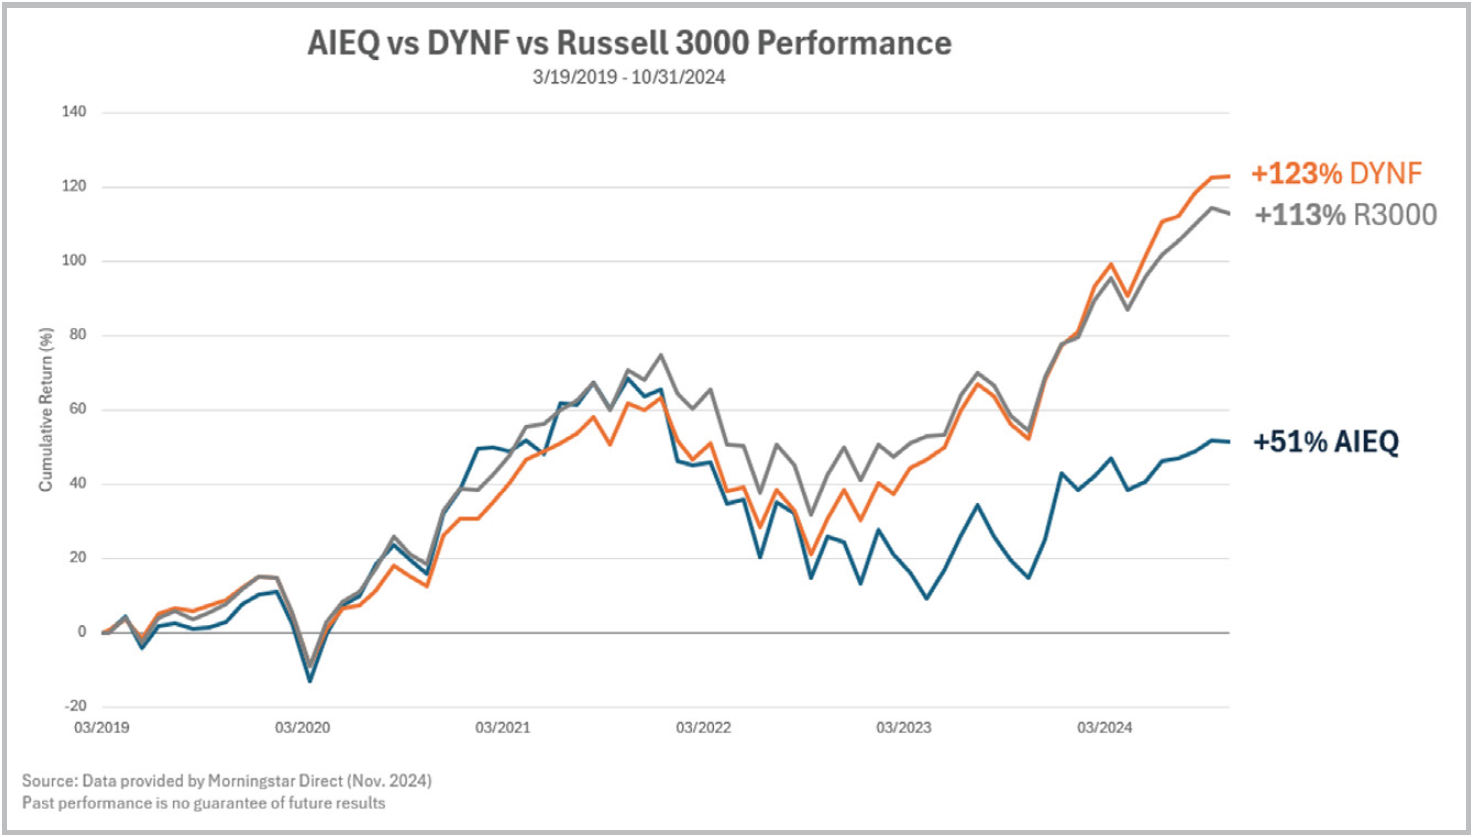
It has proven capable of beating humans in chess and other games, along with many other applications. Unfortunately for AIEQ investors, so far Watson and the EquBot team have yet to crack the code
for stock market investing. As you can see in the chart to the right, AEIQ’s performance has been lackluster.
As a result, AIEQ has amassed only slightly over $100 million in assets- not much for 7 years in business. Part of the problem is that no one really knows why the results are poor or what strategies are being used. The computer is a “black box”, impenetrable to our analysis. Also, what it does next year could be entirely different than it did at any other time. You just have to trust it. So far, the multi-dimensional, ever-changing investment environment has been a tough challenge for Ai.
While the general Ai approach from Watson has struggled so far, there is one machine learning driven ETF that has been more successful. The iShares Dynamic Rotational Factor ETF (DYNF) was launched in 2019 with a strategy focused on trying to rotate between the factor portfolios, overweighting those likely to perform best in the immediate future. BlackRock’s research team built a model that identifies conditions that have historically been associated with favorable periods of performance for specific factors such as Size, Value, Profitability, Momentum and Low Volatility.
Their model is increasingly using machine learning to improve signal identification. The computing power is focused on identifying economic regimes and other data that may influence stock market returns. Machine learning significantly improves the process by providing the ability to assess a huge number of variables across all historical environments. A more accurate assessment of these inputs lends itself well to a factor rotation strategy.
The DYNF portfolio has several comforting constraints to make sure that the selection algorithm does not take too much risk. For example, the portfolio is always invested in a blend of several proven factor-driven sub portfolios. The maximum portfolio weight to a single factor portfolio is 40%. This ensures that DYNF has enough diversification in other factors such that in circumstances when the algorithm is wrong, the total portfolio doesn’t suffer extreme damage.
DYNF has a nice track record and has amassed $12.5 billion in assets. We have followed this ETF closely for a few years and spent time with the BlackRock research team to gain insight into this model. While there is a “black box” element to their machine learning effort, we have enough confidence in the “guardrails” that we recently added DYNF to our equity portfolios.
DYNF is the first investment that we’ve selected that has a distinctly Ai driven approach. We continue to monitor other ETF offerings for opportunities.
Without doubt, there will be ongoing development and improvement in machine learning and artificial intelligence investment models. Investors ignore Ai at their own risk. New ETFs will be launched in increasing numbers. Our research team will continuously analyze these entries to identify additions that bring benefits to our diversified factor portfolios. We embrace the quest for continuous improvement.
Knowledge, research, and perspective – forged by experience – this is our value to you.
*IBM Marketing Cloud “10 Key Marketing Trends for 2017 and Ideas for Exceeding Customer Expectations”
** https://equbot.com/leadership-team/
INVEST SMARTER
Call (585) 485-0135 to discuss how a factor-based approach could pay off for you.